junk food

My fast food consumption in the past five years and its effects on health metrics

I love pizza, hamburgers, french fries, fried chicken, you name it. I also love a healthy lifestyle and habits that keep me healthy and young. 

Is there a contradiction? Not really; there’s no need to be extreme. I just need to keep my gluttony tendencies in check.

One month ago, I realized that I have my five-year fast food history in the food delivery app called Wolt. That was a light bulb moment – Data is just uselessly sitting there!

If you have read my previous posts, you know that I have sleep, recovery, mood, blood sugar, body composition, blood pressure, and blood test data.

This raises many interesting questions, like:

Does a bad mood correlate with fast food consumption?

Do a bad night of sleep equal big mac and french fries?

This is a journey to understand better my fast food consumption (and make some adjustments if needed). Maybe this will make you think about your habits or current lifestyle; the first step is to be conscious and then make changes if required.

Table of Contents

1. Overview of my fast food consumption

First, let’s start with how I define fast food. The obvious ones are pizza, hamburgers, and french fries. I also include subway sandwiches and Indian food (Indian food for me is typically butter chicken and naan bread).

In this chapter, my goal is to understand my fast food consumption in the past five years. The first task was categorizing orders by year and dividing them into a fast food or healthy (primarily salads).

Order history in past five years

Key learnings

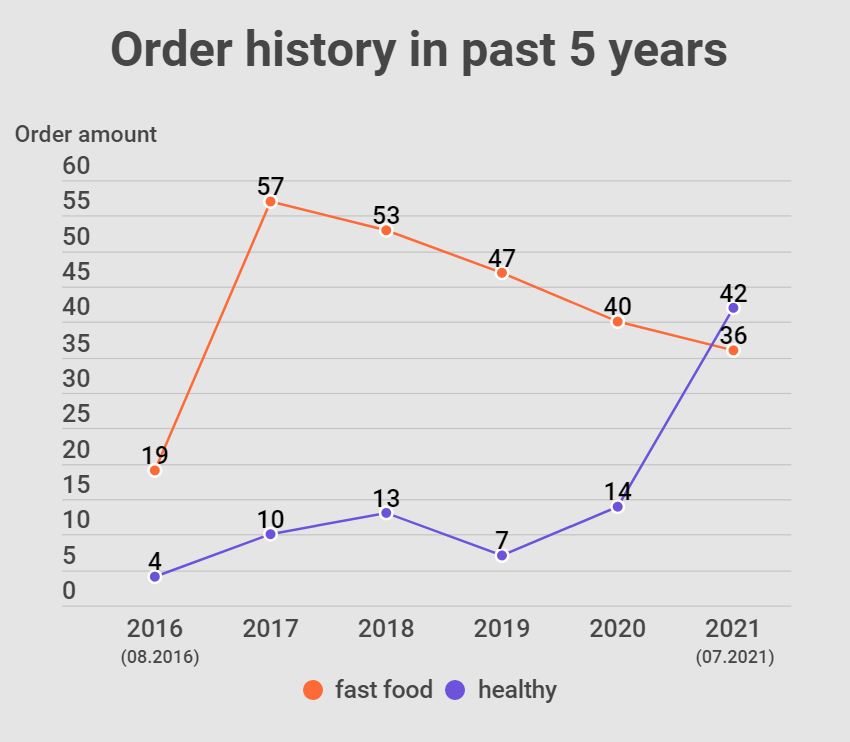
As we don’t have complete data from 2016 or 2021, it’s best to look full years to make conclusions. 

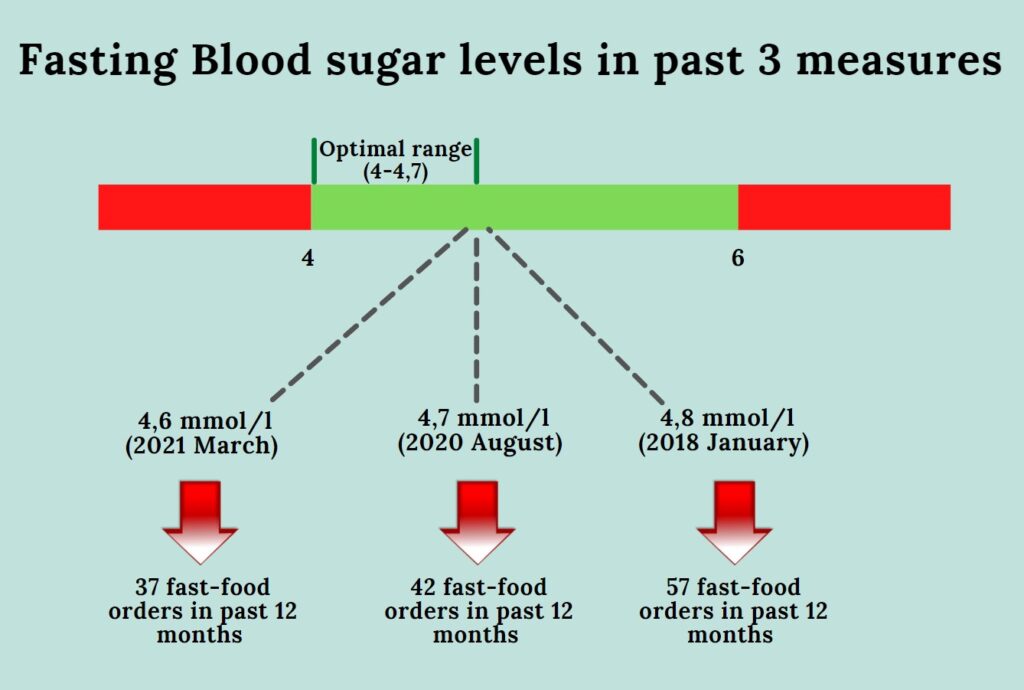
There is a clear downward trend in fast food consumption; I’m happy to see this is the case. However, it seems that most likely 2021 fast-food order total will be larger than in 2020. 

In 2020 I didn’t drink a single drop of alcohol, so there were no hangover fast food orders; thus, the number is smaller. 

For healthy food orders, 2021 was most significant.

I like the concept of cheat day; 1 day in a week, eat what you want. I try to follow that. Usually, it means a cheat meal; I don’t need to eat both lunch and dinner unhealthy.

In 2017 and 2018, we can see that there were more fast food orders than weeks in the year, meaning I didn’t follow the cheat day concept religiously. 

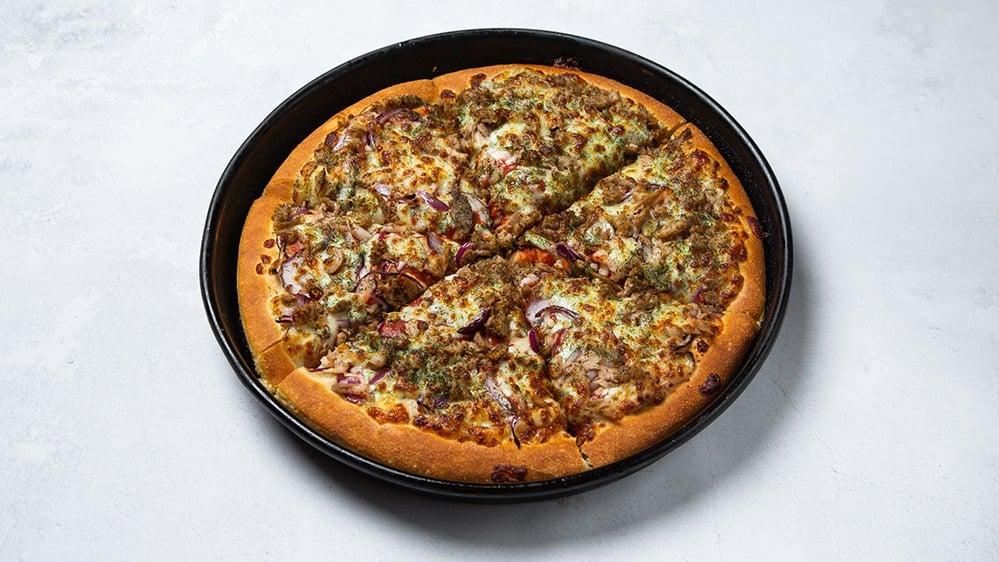
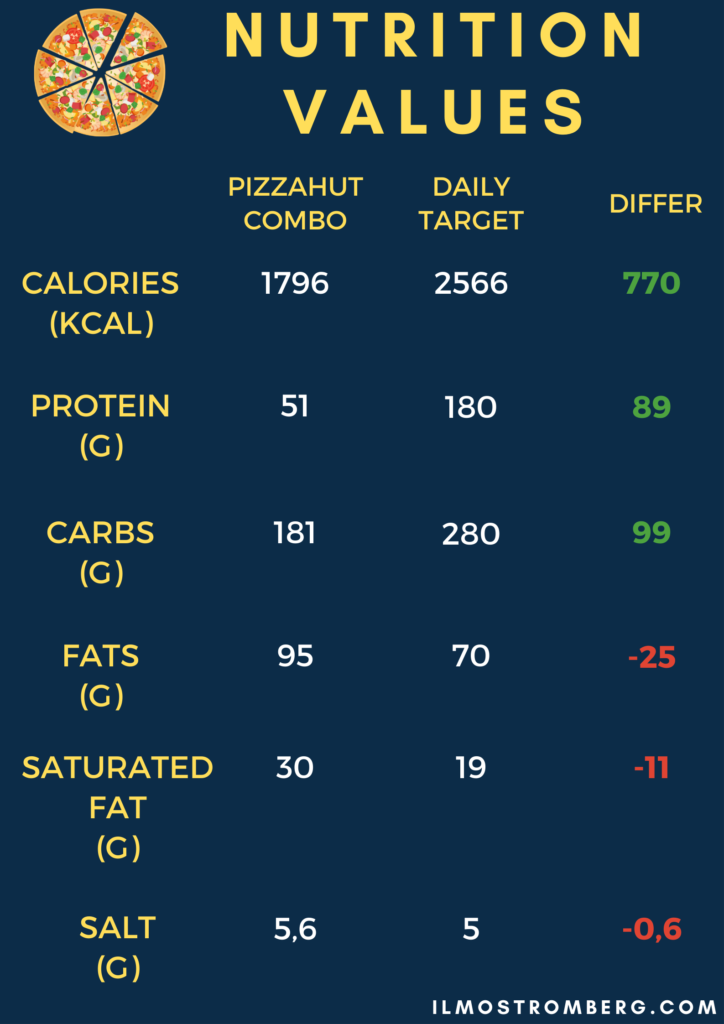
Lastly, its important to point out that fast food eaten in restaurants are not presented in this data. However, that’s a small amount in the big picture. I haven’t been to a pizza hut restaurant for few years, and I rarely eat in burger places. (I do eat in restaurants, but that’s usual work lunches or fine dining).

I estimate that if there are 40 fast food orders from Wolt, the rest 12 can come from eating in restaurants, which means one fast food per week.

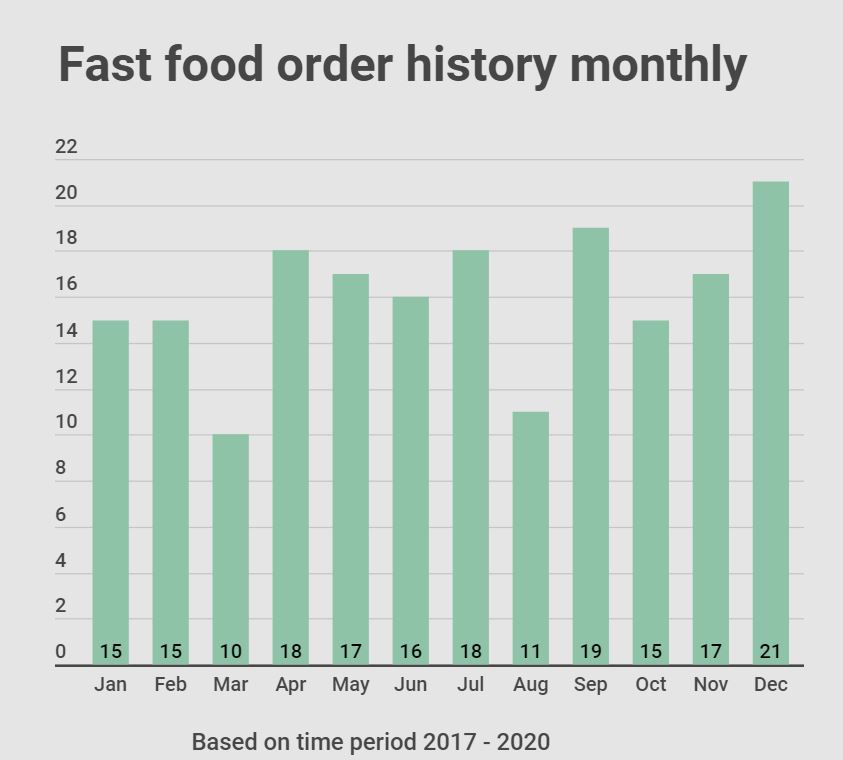
Fast food order history on month level

Key learnings

I would assume that I eat less fast food in January and August (motivation is high after holidays). For August, that is the case, January however, is close to the average level. 

It was surprising that in March there were only ten orders in 3 years. I have no clear explanation for this – it could be something to do with spring as it’s starting then.

December stands out from the rest of the months. Maybe I’m living more freely in December, the thought process being “let’s relax last two weeks of December and then get back on the track in January.”

What days do I eat fast food?

Key learnings

It should be clear what days I like to have a cheat meal.

It’s interesting how big a difference there are on Wednesday and Friday compared to Monday and Tuesday. 

Maybe the memory of tasty fast food is still present on Monday and Tuesday, but I’m fed up with greasy food on Wednesday.

2. My typical fast food order

The most common fast food order is seafood pan pizza and four cheese breads:

seafood pan pizza

I have never thought about the nutritional values of this combo, but here they are (according to official pizza hut dietary information) against daily targets:

Pizza hut combo

We can see that problem isn’t calories or carbs; it’s fats and salt that exceed the daily target values.

What kind of health consequences are there when I’m getting more than enough fats and salt?

Saturated fat is interesting and highly debated. Studies say that higher consumption of saturated fat increases the risk of cardiovascular disease [1], but there are also studies saying the opposite [2]It might all come to refined sugars; together, they are a powerful evil combination for our health [3]. Luckily, my junk food consumption is more towards fat and salt than refined sugars.

Then there are the trans fats that are not debated. It’s not clear does Pizza Hut pizzas still have trans fat. In the 2015 blog post, they stated that they have partially eliminated trans fat from their foods [4]. Eliminating is a strong word for something that is done just partially.

For salt, the case should be clear, more than 5 grams a day is a cardiovascular risk, and there can be an increase in blood pressure [5].

Before analyzing the health metrics, let’s start with the mood and fast food consumption.

2. Mood & Fast food consumption

I have used the Daylio app since 2018 every day to track my mood. The obvious question is; what is my happiness level on the day when I order fast food.

Key learnings

In 2018 there was no difference in average happiness level and happiness level when I ordered fast food (2018 data started from April, so it’s not full-year data).

The most significant year was  2019 when there was an average 0f 0,355 difference (9%) in happiness. The difference narrowed in 2020 and 2021. 

Based on this, we can conclude that having a bad mood can increase fast-food consumption.

I rate my mood at 8.00 pm, as Dailio reminds me – Usually, I have already eaten fast food that time, so the question is, what kind of effect fast food has on my mood after I have eaten it?

My subjective feeling is that stress or a bad mood increases the chance of fast food consumption, and after I have eaten the food, I feel better most of the time. If that is true, the difference between the year average and fast food day average could be even more significant. But for now, it’s just a theory without data.

3. Heart Rate Variability (HRV in Oura) & Fast food consumption

What about HRV (an indicator of recovery); does low-value increase the chance of fast food consumption? In theory, it makes sense. I have poor recovery during the night (Oura nighttime values), which means I’m tired during the day, thus more likely to consume fast food.

decreased hrv fast food consumption

Key learnings

In 2019 this didn’t seem to be the case as fast food day HRV was similar to the yearly average and healthy order day average.

However, the most significant difference seemed to be in 2018 and 2020. 2020 is more interesting as it was a year without a single drop of alcohol.

Days of alcohol consumption tend to drop nighttime HRV, but there’s also a hyper recovery effect the day after hangover day when HRV skyrockets. This will affect the data as fast food consumption on hangovers goes hand in hand. There are also cases where I have forgotten to put a ring on the day of the party, which means the night of low-value HRV is not captured, but hyper recovery in the next day is.

That’s why I emphasized 2020, where there was a significant difference in HRV without noisy data from alcohol consumption.

Based on this, If I want to eat healthy most days, I should keep my HRV on a good level.

What about another way around? Does eating fast food hinder recovery?

does fast food consumption decrease night after hrv

Key learnings

It makes sense that the blue line (HRV night after fast food) is highest in 2018, 2019, and 2021 due to the previously discussed hyper recovery effect. I removed hyper recovery days (no Saturdays, Sundays, or Mondays) in the orange line. It surprised me that only in 2018 did there seem to be a clear difference compared to yearly averages. 

What about the meal timing that hasn’t been taken into consideration here? That should be the most significant factor for impacting HRV. 

When the order was placed in wolt app after 5:00 pm (N=26), the average HRV was 71,23, which is higher than my all-time average HRV.

Based on this, HRV wasn’t affected by fast-food eating, even when mealtime was adjusted. I have to say that I’m amazed by this. 

4. Sleep metrics (Oura) & Fast food consumption

If I sleep only 4 hours a night, I know for sure that I crave fast food. This effect should be visible in the metrics.

Let’s look at it:

average sleep vs sleep time on the day of fast food eating

Key learnings

On average sleep time we can see clear difference in 2018 and 2019, however that difference is dimished on rest of the years. It cannot be explaining factor in 2020 example, when sleep time was 9 minutes longer in the days of fast food eating. 

I still believe that sleep time is major component on this, but not the only explaining factor.

I also looked into sleep effiency, rem- and deep sleep and awake time but didnt find anything significant there.

Does eating fast food decrease my sleep statistics?

For this question, its important to look eating time based on the time wolt order was created. 


Does the timing of fast food consumption affect the lenght of sleep

We can see a clear trend here, later the order time, less time I slept afterward. Is it because I stay up longer, or can fast food cause sleep disturbances? For this, we need to look at sleep efficiency (percentage of time spent asleep vs. awake while in bed)

The trend is the same as in overall sleep time. We can say that eating fast food after 6.00 pm does decrease sleep quality.

This was also visible in rem sleep (but not in a deep sleep):

REM-sleep on night after different fast-food order times

The sample size is smaller here as I only use Oura ring version 2 in this data. (There were significant differences in how Oura measured REM and Deep sleep between versions 1 and 2)

In sleep metrics, late-night fast food consumption is harmful to sleep quality, and poor sleep can increase fast-food consumption. This can be a vicious cycle!

5. Blood tests & Fast food consumption

What about blood testing and fast food consumption? Can we see any connection here? Let’s start with blood glucose levels which is one of the essential parameters for longevity.

Fasting blood sugar levels in past 3 measures

Key learnings

Levels health wrote an excellent article on optimal blood sugar levels [6]; the optimal range (4-4,7 mmol/l) is based on this article.

We can see that in 2018 I was barely outside of this optimal range; at the same time, I had the highest fast-food order count in the past 12 months in this comparison. In 2020 there was a significant drop in fast food orders and a slight improvement in blood sugar levels. The same trend continued in 2021.

It’s too early to make decisive statements about this data, but the trend seems to be in the right direction in health-wise. 

I want to include data from the continuous glucose monitor app Veri; What scores do I get when comparing subway footlong sandwiches and healthy salad?

Veris meal stability score

Meal stability score is based on peak glucose, glucose after 2 hours, and time above the optimal range. We can see that Subway sandwiches usually get the worst scores. Outside variables like exercise, sauna, stress and sleep affect meal stability scores, so sometimes unhealthy food can get better scores than healthy salad.

You can read more about Veri here.

Cholesterol levels and fast food consumption

This is the most interesting blood parameter for fast food consumption. I’m expecting to see more significant results here compared to blood sugar. Let’s see:

cholesterol test results in past 3 measures

Key Learnings

Out of 4 metrics, 3 got the best result in 2021. This is very promising and expected as fast food consumption was lowest in 2021 (past 12 months).

That wasn’t the case for big bad LDL, though. Fast-Food consumption and higher LDL are linked [8], so I would have excepted higher value for 2018.  But is 2,3 mmol/l optimal? A study with almost 200 000 men concluded that low levels of LDL (under 1.8 mmol/l) have the highest all-cause mortality risk. The optimal range seems to be around 2,5 mmol/l – 3,3 mmol/l for the lowest all-cause mortality risk [7]. This data represents the Healthy Korean population with an average age of 40, so the optimal range for 34-year-old Finnish health bloggers could be different.

Overall I’m happy with the 2021 values, even with the LDL.

6. Wrap up

Did this quantified self-research change my mindstate regarding fast-food orders? Have I ordered fast food during this research?

Yes, I have, in the beginning, but I’m also looking at it differently than before. I’m more conscious about it: I understand how mood and sleep are connected to fast food consumption. Maybe the cheat meal on Sunday late evening isn’t the best choice for every week.

This brings another point, do I want to support companies like Mcdonald’s that undoubtedly increase the rate of heart attack incidences in the population [9].

A better choice would be to support local companies or even cook healthier homemade burgers. When I’m extremely tired or feeling down, of course, I’m allowing myself to make fast food orders; there’s no need to live too strict a life.

Giving away a cheat meal a week shouldn’t be too hard either; in the future, it could be two times a month, and that gives room for special situations.

I will continue to monitor my fast food consumption through the Wolt app and Dailio (fast foods that I ate in a restaurant). Maybe in the upcoming years, I will write an updated status on this.

Thank you for reading!

(If this topic raised questions, thoughts, or revelations in your own life, feel free to leave a comment or email me)

SHARE THIS POST

Facebook
Twitter
LinkedIn
WhatsApp

Leave a Reply

Learn with me!

Stay updated on most interesting biohacking and personal development stories