

Updated 27.8.2021
Key objective
As a long-time oura ring user, it’s time to take deep dive into the world of heart rate variability (HRV). In this blog post, I’m going to explain what I have learned in 1000 days with Oura and how to interpret different nighttime HRV results based on my own experiences, and most importantly: how to increase your HRV.
Table of Contents
HRV - What is it?
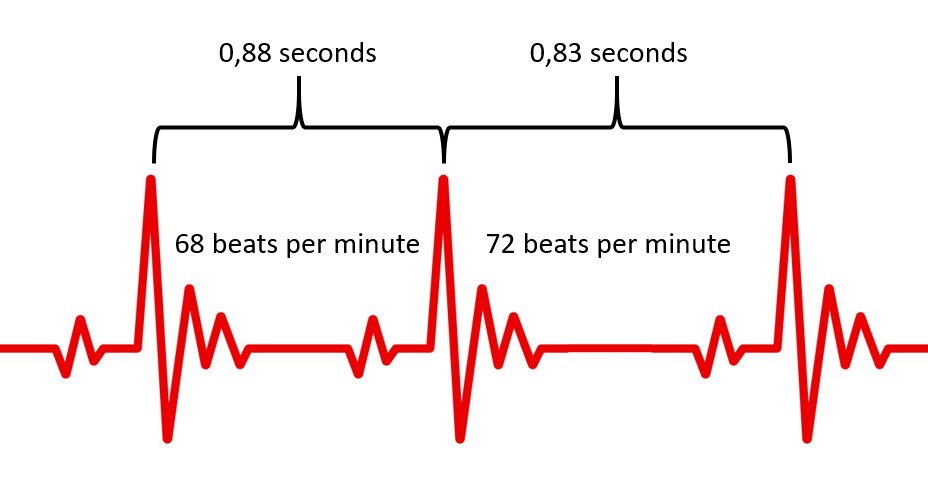
HRV has been popularized in the past few years with the help of different gadgets. What is it, and why should you measure it? Simply put, heart rate is the number of heartbeats per minute, and HRV is the variation in the time interval between heartbeats.
This variation is controlled by the autonomic nervous system (ANS). ANS is like a primitive background system that controls our heart rate, blood pressure, vascular tone, respiration, and digestion. ANS subsystems are sympathetic (fight or flight) and parasympathetic (relaxation) nervous systems. [1]
HRV - Why measure it?
HRV is the most accurate way to estimate your ANS balance: meaning how well your body responds to daily stressors. HRV value is highly personal, so it isn’t comparable between individuals. However, in most cases, we can say that high HRV indicates good recovery and general fitness, and low HRV opposite. HRV gives more insight than heart rate, example upcoming illness can be potentially seen on HRV values [2]. Abnormally low HRV for a long time can also indicate an upcoming heart attack [3].
For me, as an athlete, it’s an important variable to monitor. I want to train hard but avoid overtraining. Nightime HRV values give me a good signal for the day: how hard should I push in training today?
Before going into my personal HRV values, it’s good to remember that HRV is highly individual and is based on genetics, age, and lifestyle. Before you compare your values, you should read this.
My normal values
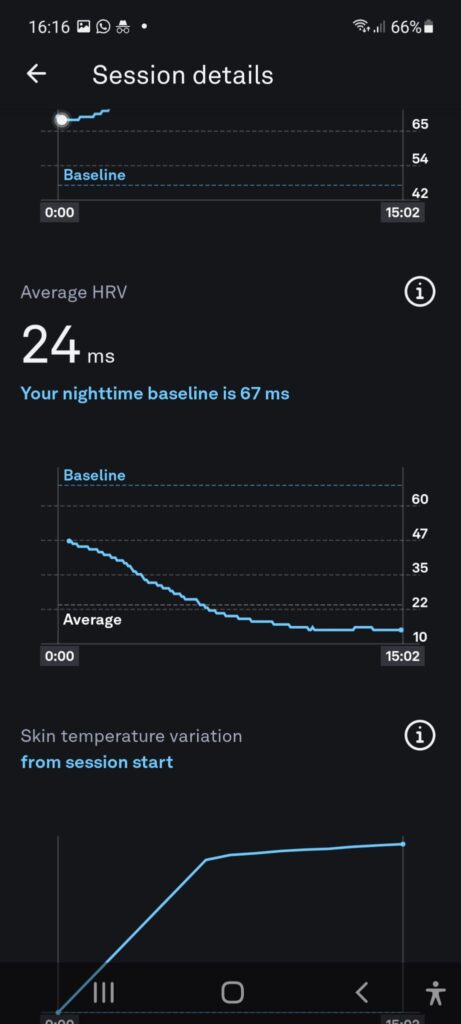
If I had to pick the most important value from Oura Data, it would be HRV. I can guess my nighttime HRV with 90% confidence +-5. My confidence is based purely on what I did the previous day.
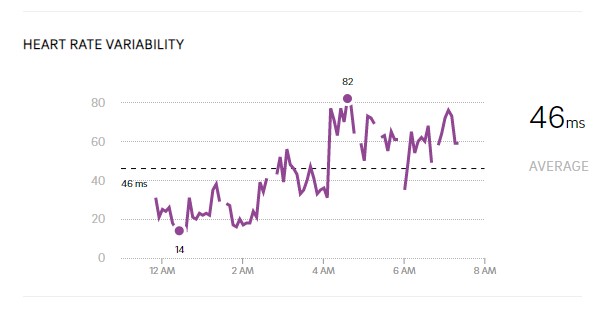
My average HRV is 70, and it normally fluctuates +- 10. I take it easy with training if my HRV is under 60, but it’s not a strict rule. For example, there’s no reason to skip training today if I ate the previous day’s late-night meal, which affects HRV negatively.
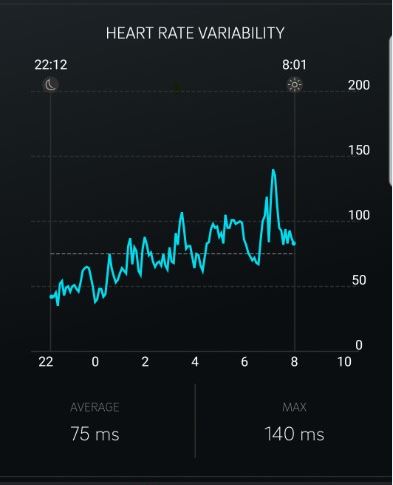
As you can notice, the graph has a positive trend line: HRV value increases throughout the night. This means that I’m recovering well from previous days’ stressors. This is an ideal graph for me. Now, let’s look at abnormal values and the reasons behind them.
Exceptionally high values
I have noticed that my body goes to special recovery mode in the following situations:
Low HRV and high pulse on day 1 because of heavy training or stress. My HRV rebounds in day 2, typically 80-90 range.
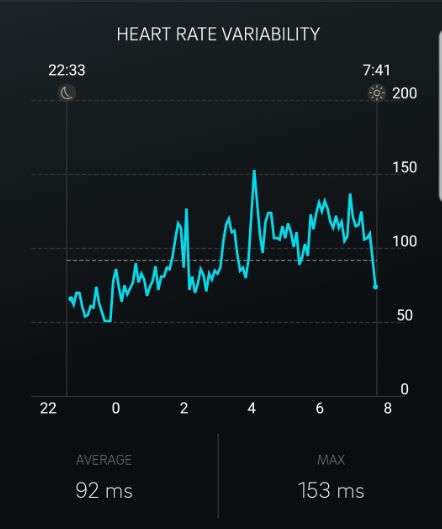
Day after heavy drinking – There couldn’t be a better example than a new year’s eve party. January second, my HRV was off the roof. I have broken the 100 marks in HRV many times with “hangover hyper recovery.”
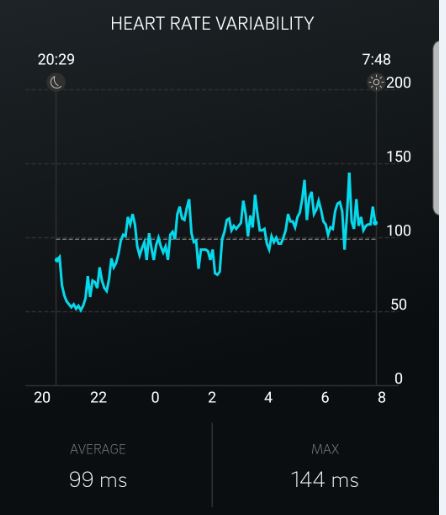
Now the question is: what happens in my body when HRV goes exceptionally high? Is it a good or bad thing? And what if HRV is constantly and significantly above your average values? Ouraring.com states that “Low HRV is a reflection of your fight-or-flight system appropriately dominating to get your heart rate up for the activity. Your HRV will rebound afterward, as your rest-and-digest system takes over to help you recover”. I believe this is the situation in my case, although heavy drinking is never good for your body.
However, I have wondered about overtraining and its effect on HRV. Medicine and science in sports and exercise published interesting studies on functionally overreached athletes. The study divided triathletes into two groups:
Intensified training group (n=13) – Normally training 11 hours per week, but in this study, 17 hours per week for 3 weeks
Normal training group (n=8) – 11 hours per week
The study demonstrated decreased performance and increased HRV in intensified training group [4]. This shows that high HRV is not always good.
Exceptionally low values
I have recognized 3 different situations where my HRV is abnormally low (for me). The first one is physically exhausting training, for example, long-distance running.
Normally my lowest HRV point is around 50, but now the average was under 50. This means recovery day (only walking and stretching).
What about alcohol? And I’m not talking about few glasses of wine:
No wonder you feel like shit after a heavy day of drinking. My HRV was close to zero, which is pretty scary.
How does being sick compare to physical exhaustion or heavy drinking in terms of HRV values? I have been 2 times in fever during 1000 days of Oura use.
This was a bad fever, body temperature close to 39 celsius. My HRV was under twenty 3 days, the lowest value being 12, which is an all-time low. It’s important to point out that my heavy day of drinking was in the same HRV range as high fever, so alcohol in moderation, ladies and gentlemen! Now, let’s look at the big data. Can I find any correlations from 2017 to 2020 in terms of HRV and other Oura variables?
Correlations with other Oura data points
1. Readiness score (moderate positive correlation 0,54) - No brainer here. HRV increases readiness score
2. Time in bed (weak positive correlation 0,31) - Interestingly, time in bed correlated second most, better than total sleep. I had to think reason for this a while. Analyzing the data I saw trend that my morning HRV was usually high, even if I have already woke up. Every other day Oura logged two to ten minutes wake up time in morning before I got out of the bed.
3. Total sleep (weak positive correlation 0,25) - HRV values are highest middle of the night/morning, so it makes sense that total sleep has positive correlation.
4. Sleep latency (weak positive correlation 0,21) - I have no explanation for this.
5. Light sleep time (weak positive correlation 0,21) - Interesting that only light sleep got into top 5, not REM or deep sleep.
1. Lowest resting heart rate (Strong negative correlation -0,75) - Strongest correlation of all the variables: HRV goes up and heart rate down. One might ask, where do you need HRV if heart rate already can tell your recovery status. Even though there is strong correlation you have to look HRV and heart rate separately. August 15 my HRV was 59 and Heart rate 47. September 3 my HRV was 72 and heart rate 47. This is good example how HRV gives me much more insight on my recovery than heart rate.
2. Average resting heart rate (moderate negative correlation -0,65) - Similar to 1. lowest resting heart rate. If heart rate is high, it will have negative effect on HRV.
3. Bed time (weak positive negative correlation -0,31) - Based on this, getting bed early may potentially improve your HRV.
4. Temperature deviation (weak negative correlation -0,25) - This makes sense, especially if temperature raises (fever), it will have negative effect on HRV.
5. Respiratory rate (weak negative correlation -0,24) - Slow breathing equals good HRV values. You can read this more in my other blogpost "Best breathing techniques to increase HRV and lower blood pressure"
Correlation with mood
What about mood and HRV? I use an app called Daylio to track my mood. Mood can be anything between 1 (terrible) – 5 (feeling happiest ever). Every evening I rate my mood and choose activities I did that day. Daylio’s key idea is to find correlations between different activities and how they affect your mood. I have divided HRV into 3 categories in Daylio: 1. HRV under 60 2. HRV between 60-70 3. HRV over 70. Each evening I choose the right category for that day.
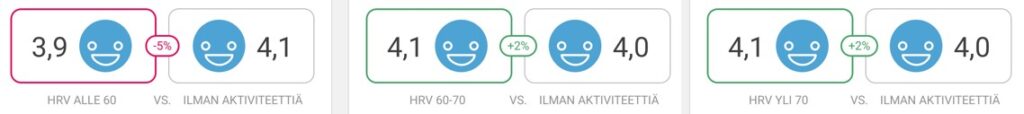
Data from Daylio shows that my happiness is 3,9 when HRV is under 60. My happiness is 4,1 when HRV is either 60-70 or over 70. These results represent almost 200 days of data logging. I am not surprised by the results, although I expected an even more significant difference.
Connecting HRV to mood is not a new idea: A study published in 2018 stated that there is a bidirectional connection between HRV and depression, autonomic function affecting depression risk, not vice versa, as previously thought. [5]
Long term trend on HRV Data
We tend to focus too much on single-day values when a week, month, or year levels tell us much more.
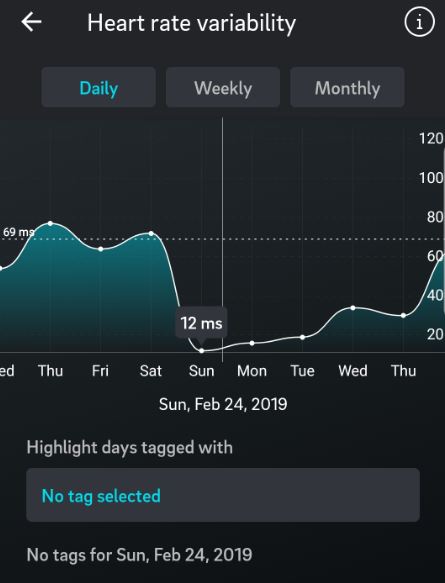
It is known that HRV decreases during aging, especially when you are 30 to 50 years old. This is very interesting when we have logged many years of HRV data.
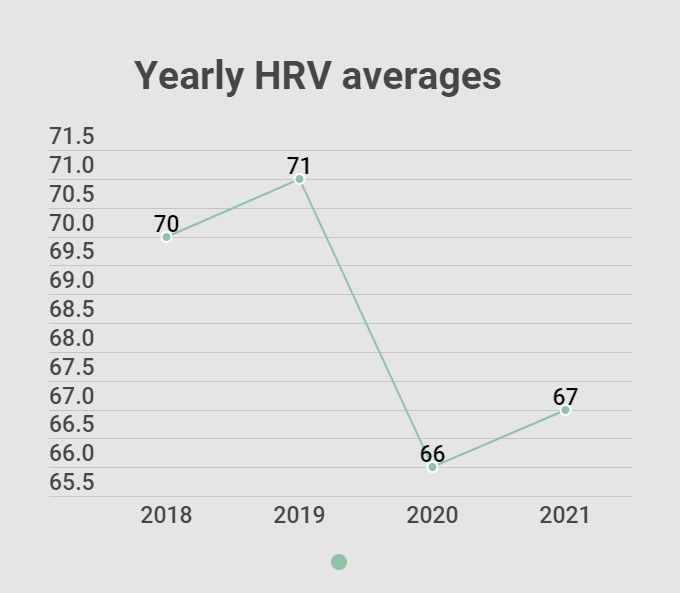
I had the highest yearly average in 2019, but then it dropped to 66. I run a lot in 2019 but not that much in 2020. Hopefully, I can bounce back in 2021 (I’m really into jump rope at the moment, interesting to see if it brings any HRV gains)
Using Oura moment to capture HRV (Use cases)
Then there’s the Oura moment feature, which allows you to monitor your HRV, heart rate, and temperature whenever you want. The only limitation is that you must do it still; otherwise, data won’t be captured properly.
The most common use case is meditation. I actually did last year the 30-day challenge where I meditated 1 hour a day in the morning. I never wrote a blog post about it, but here are the results for HRV:
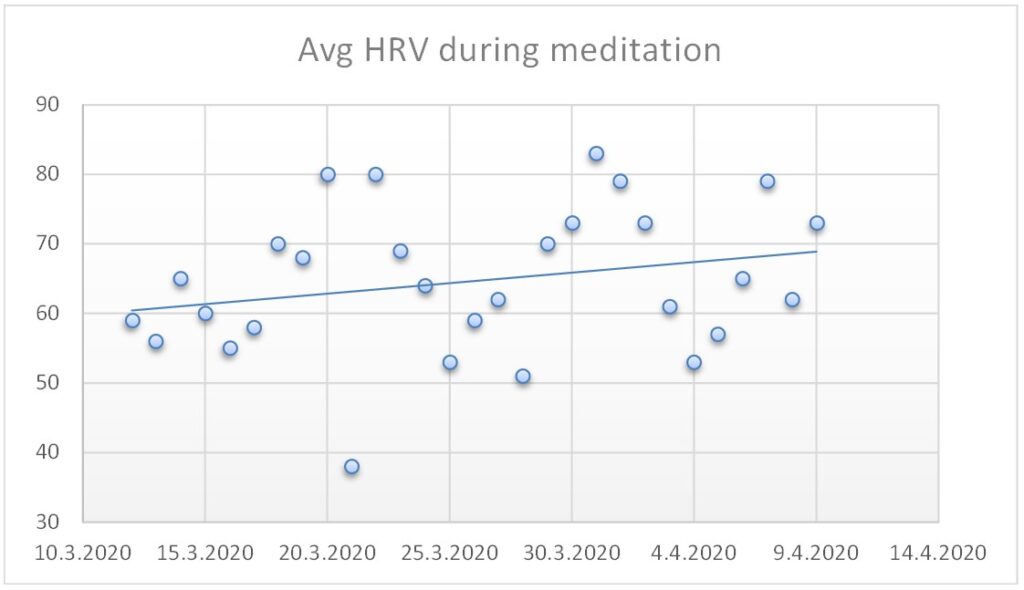
There seemed to be an increase in my HRV as the challenge progressed. We can hypothesize that I got “better” with meditation, meaning I was more relaxed and present at the moment, which increased my HRV also.
Here is an example graph from a one-hour meditation session:
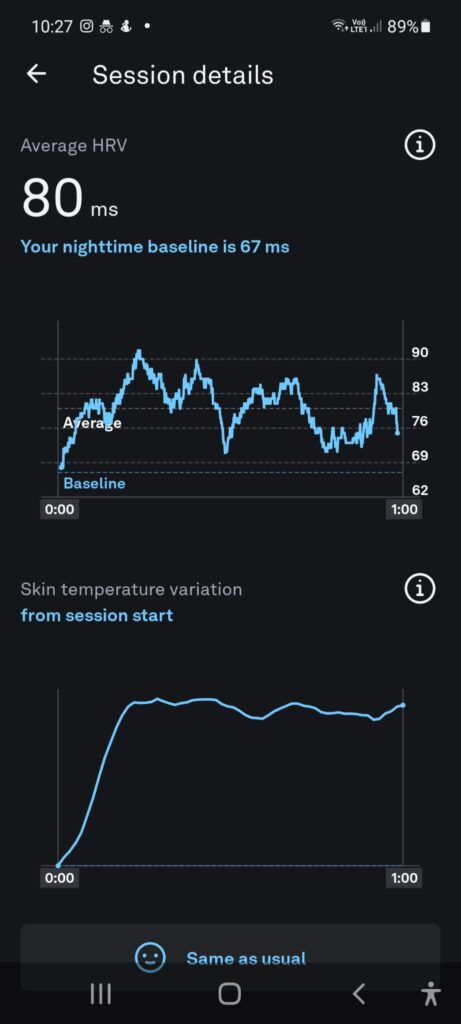
We can see that the lowest point in HRV was in the beginning, and there was a rapid increase from 60 to 90. There were also moments when HRV dropped, but the overall trend was positive.
How does the HRV graph look when I perform 20 minutes Wim Hof breathing exercise?
HRV graph is like a big mountain; this always happens with a 20 minute Wim Hof breathing exercise. 20 minutes consist of 4 rounds, so with 2 rounds, it’s 10 minutes, and that’s approximately the highest peak in HRV in this picture.
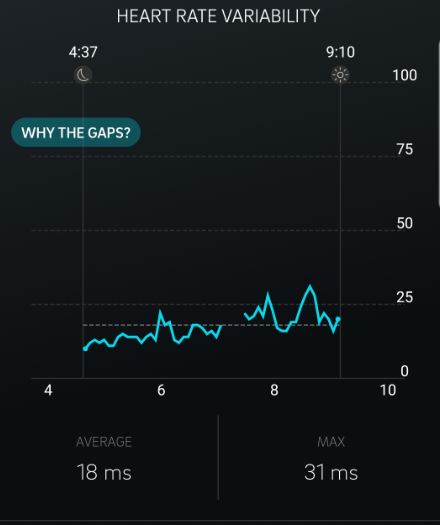
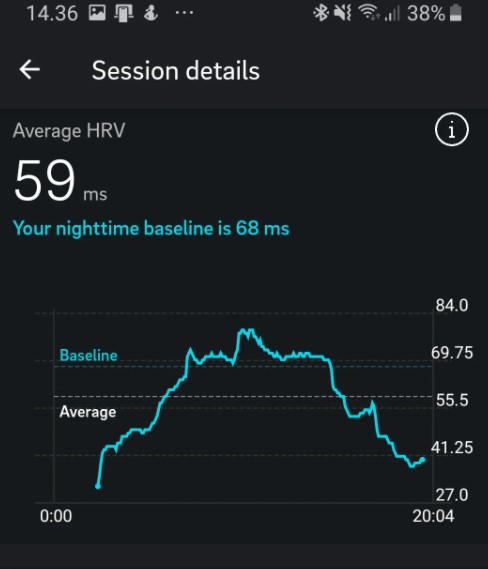
What about Sauna?
We can see that HRV decreases from 47 to around 10 in fifteen minutes. Obviously, having a value that low in the rest wouldn’t be optimal, but in short periods with Sauna or physical exercise, it actually strengthens the body.
How to increase night time HRV (short-term)
We should look at this from two different angles, how to increase HRV in short term (next night) and long term (upcoming months).
For the short term what matters most is what you did in the last 4 hours before going to bed. What you want is a good jump start for your HRV when you start sleeping. Here is an interesting graph on HRV beginning of night relation to average HRV for that night:
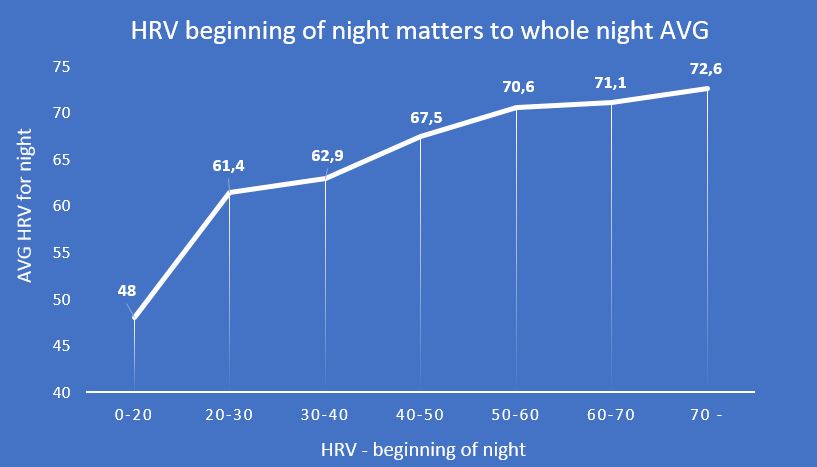
When my HRV is in the range of 30-40 beginning of the night, my avg HRV for the night is 62,9 which is pretty low for me. Based on this graph, it’s optimal to have HRV in 50 or more beginning of the night to ensure proper recovery. How can you ensure good HRV values beginning of the night?: Here are do’s and don’ts:
Do's
Warm shower/bath to improve sleep quality and sleep onset [6]
Acupressure mat for 20 minutes before bed, lowers resting heart rate and improves HRV [7]
Meditation / calm breathing before bed (especially 5 seconds in and out) [8]
Magnesium supplementation [9]
Gratitude journaling could improve HRV [10]
Omega 3 supplements [11]
Coldwater immersion after training [12]
Intermittent fasting can improve HRV [13]
Make sure you get the proper amount of sleep (Based on my data)
Get bed early (Based on my data)
Don'ts
No hard training sessions in the late evening and remember rest days
Avoid big meals 4 hours before bed
No alcohol
No caffeine in the evening
Don’t stimulate your brain with work, gaming, or TV before going to sleep
Long fast (48h) decreases HRV [14]
It is possible that electric devices cause radiation which affects harmfully HRV [15], so make sure your bedroom is free of those devices or in airplane mode!
How to increase nighttime HRV (long-term)
1. Improve your cardio, improve your HRV [16]
2. If you have some additional weight, lose it and see the improvements in HRV [17]
3. Sauna – Even though there might not be an improvement in HRV in the short term [18], I truly believe it will increase its long term as frequent sauna use has been linked to improved cardiovascular health and reduction in inflammation and blood pressure [19]
This Post Has 20 Comments
Thanks for sharing. I came here from the Facebook group. How often you you train per week?
It’s interesting to see that your worst days are my average (hrv average at 30) even though it’s not 100% comparable.
Thank you for your comment! I train 4-6 times per week.
Comparing HRV is tricky, but you should monitor your own average. Depending on your lifestyle you can make HRV improvements. If you are already living healthy, then HRV improvements can be marginal but if not, you can make some drastic improvements. Example, maybe with my genetic background, My avg HRV range can be 40-75, now I’m ~70 so I’m close to upper max limit.
Pingback: How does your HRV rank against other Oura users? – Addicted to optimization
If high HRV is a sign of health, then why does HRV skyrocket when hungover? Isn’t a hangover an “unhealthy state” similar to a fever? Yet with a fever, HRV is low. I don’t understand…
Hi CJ
Thanks for good question and sorry for late reply. Most of the times high HRV is a sign of good health. Hangover and being drunk is unhealthy state – we can see that from Oura values, but night after hangover “hyper recovery” happens where your body repairs itself and in that state HRV is high. It’s good that body repairs itself but of course that shouldn’t happen a lot or never in ideal situation.
Hi,
Thank you for doing a really insightful article 😀
When you complete Daylio in the evening are you using the Oura HRV average values from the morning?
As I’m also an avid Daylio user so interested in trying this.
Thanks
Hi Mick
Thanks for comments
I use the previous night’s HRV average values for Daylio. In Daylio, I have 3 different groups: HRV under 60, between 60-70, and over 70. It’s effortless and easy, so set it up for yourself. You might find interesting data!
-Ilmo
Thanks, I’ll give it a go.
I assume you are completing Daylio once a day at the end of each day?
Mick
Yes, automatically Dailio pops up on my phone at 20.00 pm
Pingback: Kuinka Valmistautua Ensimmäiseen Maratoniin - 6kk Juoksusuunnitelma - HealthyVeganAthlete
Pingback: How to Run First Moderate Marathon - 6 Months Training Plan - HealthyVeganAthlete
Hey Ilmo, thank you for this great post. I just bought an Oura Ring and my HRV was 91 the first day and then went up to 100 on the 3rd day. My question is how many days I should wait to get reliable data? I have been running 4-5 kms at least 3 times a week for 6 months and for the last 5 years I have been taking more than 10K steps every day.
My other question is about Apple Watch. I have the latest Apple Watch and a Fitbit (I have been using the Fitbit for almost more than 4 years now) and Apple Watch is way off with Fitbit and Oura Ring. Apple Watch tells me that my Cardio Fitness is below average and Fitbit tells me that my cardio fitness is in good to very good range. Do you have any feedback about Apple Watch or any other tracking equipment out there and how consistent and reliable they are?
Hello Yeko
Thank you very much. In a week you get an idea of where your average is but there’s also normal fluctuation in monthly data (ex. winter months vs summer months). 91 or 100 is a nice number, definitely in the upper end.
I assume you mean VO2 max when you say cardio fitness? I have VO2 max in my Garmin, but haven’t paid much attention to it. Theres scientific article “Validity of Wrist-Worn Activity Trackers for Estimating VO2max and Energy Expenditure” and it states The tested devices did not show valid results concerning the estimation of VO2max and EE.
Hence, the current wrist-worn activity trackers are most likely not accurate enough to be used for
neither purposes in sports nor in health care applications.
Just to chime in, a surprisingly good estimate of your vo2max can be found at worldfitnesslevel.org. It gave me the exact same result as test with the cardiologist and an ergo meter bike. I am using a polar armband for tracking. Regarding HRV I find surprising that values are so different for anyone : my Oura ring states that my average is 42 ms but my lowest HR was 35 at night recently with an average of 42.
Thanks, I’ll check that site! You have a strange combination with HR and HRV – usually that low heart rate means sky-high HRV!
Not specifically about HRV BUT more about using a Polar Verity Sensor to track my activities for Strength Training, Elliptical and Tai Chi. Getting those data into Polar Flow and Apple Health and importing it to Oura so it could be accounted for properly in Oura Activity tracking.
Is it even worth doing this?
Does Oura even take into account Heart Rate in regards to this imported activity?
Oura does not sense this activity properly and I have to add it manually as Easy, Moderate or Hard.
Honestly, I have no idea. I’m only using Oura as night time device. I have Garmin watch for daily activities. That said, I’m investigating different platforms to combine this data instead of good ol excel
Ilmo please do update this post. I suppose since published you have a lot of interesting info to share. Especially compared to glucose data from Veri CGM.
I’m actually thinking to create a new post – “Over 5 years of Oura HRV data – What have I learn” or something like that
I have noticed some similar patterns with my Apple watch. I sometimes see spikes in the 200-300 range, but my average fluctuates between 64-74. The tips at the end were very useful, thanks!