What are the key takeaways from 100 hundred days of glucose data? Its been a fascinating ride to understand metabolic health better, and that ride will continue in the future also.
First, I will discuss key takeaways and then focus areas in 2022.
Key takeaways
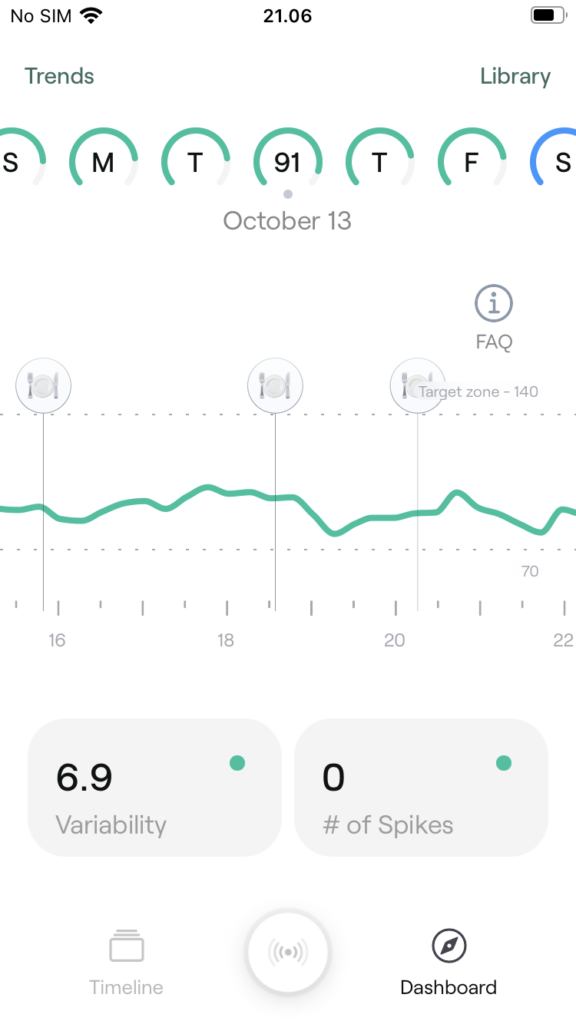
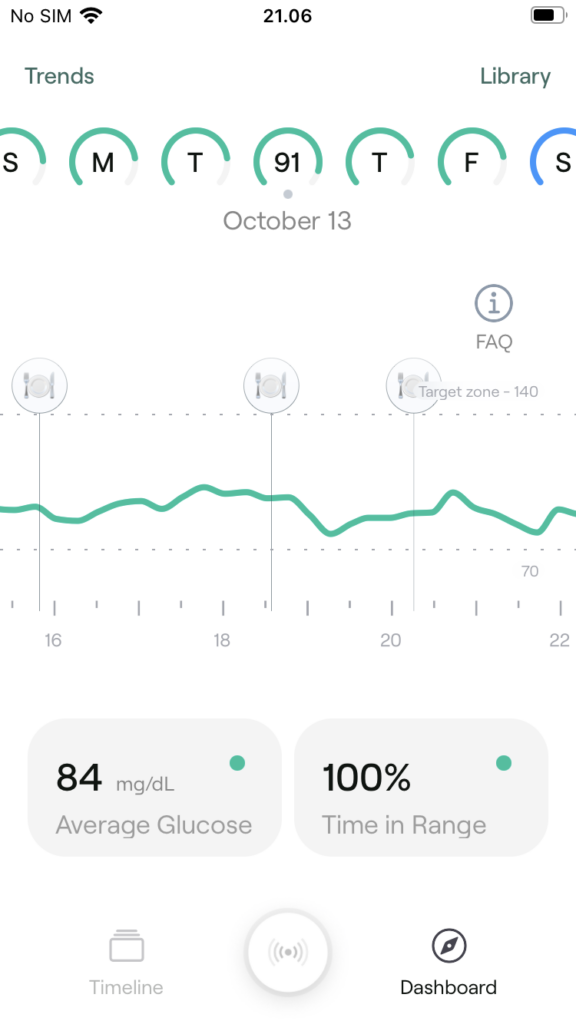
1. To get a complete understanding of metabolic health, routine blood tests are not enough. Continuous glucose monitoring is the way to get 24h view of glucose levels.
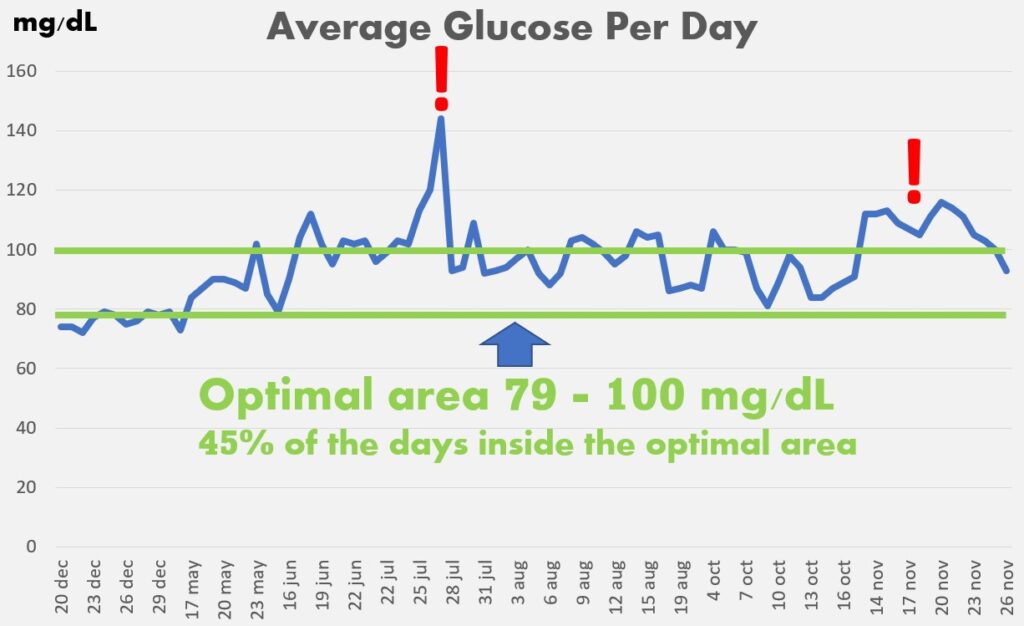
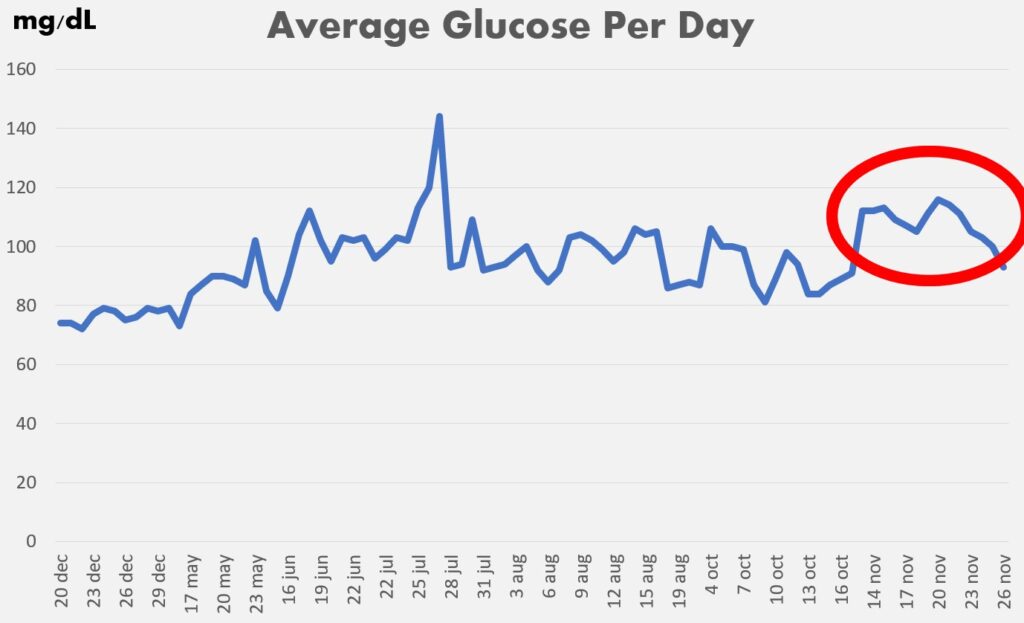
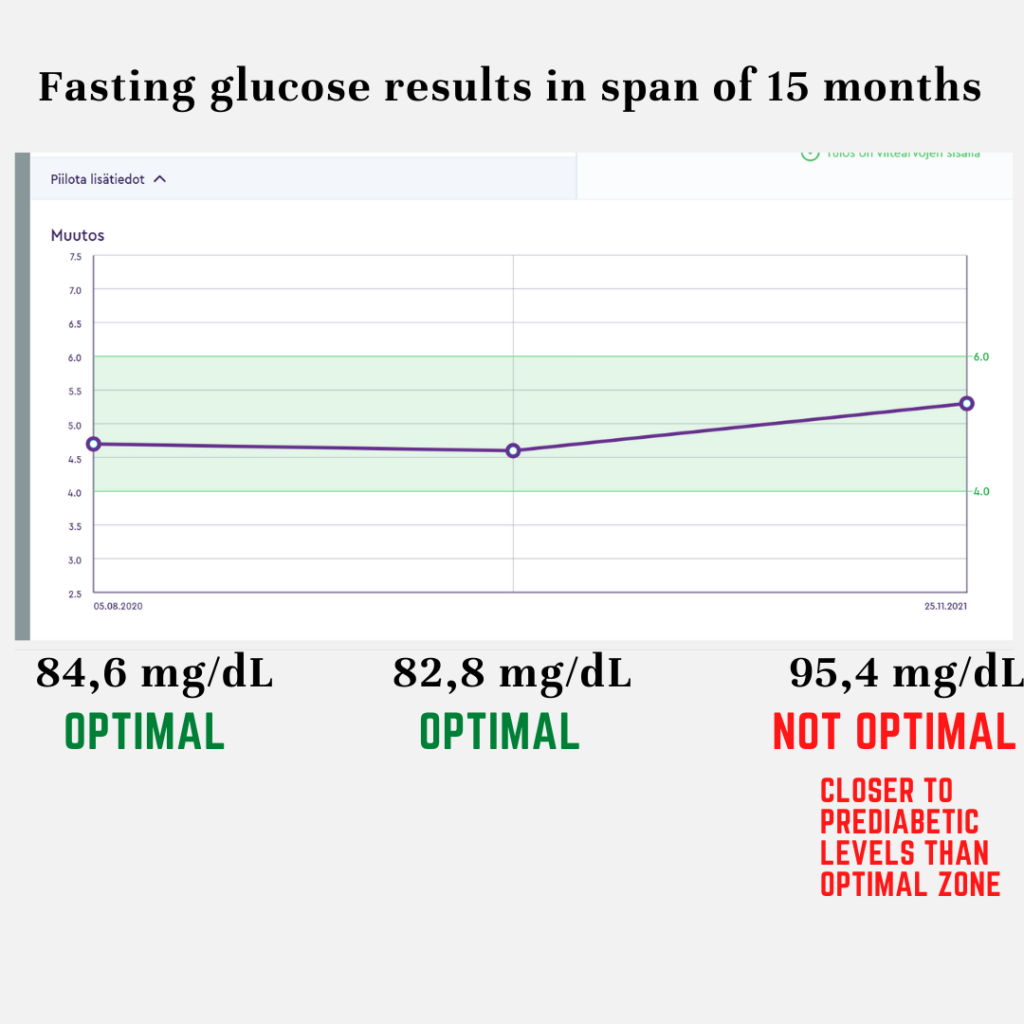
2. There can be significant changes in average glucose levels, even in a span of twelve months.
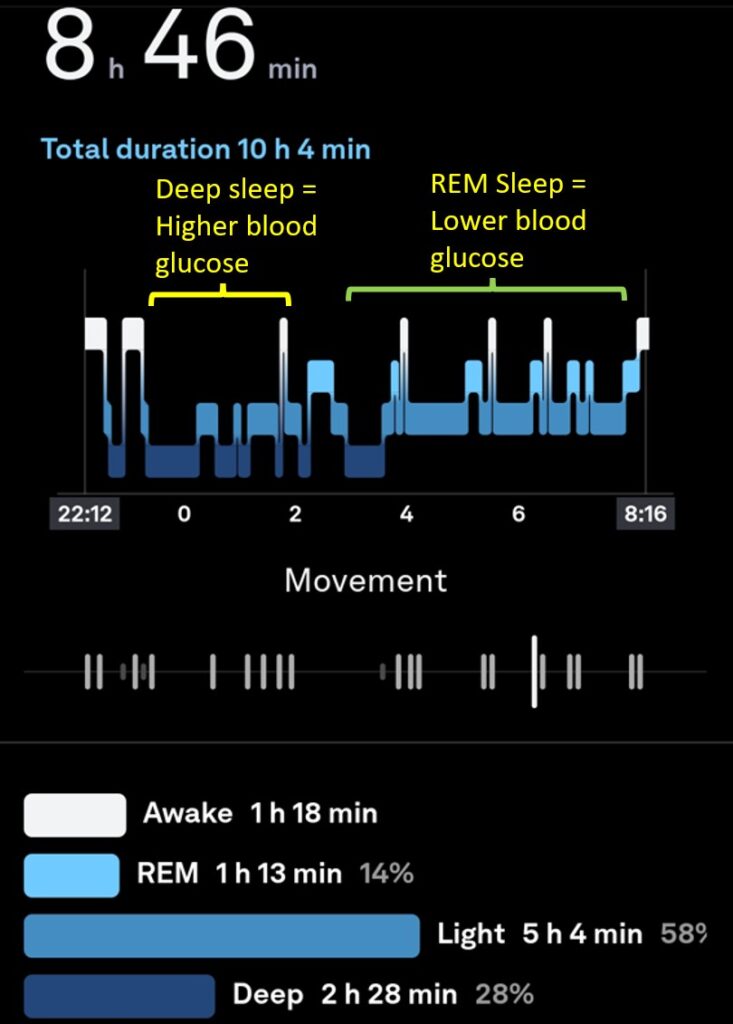
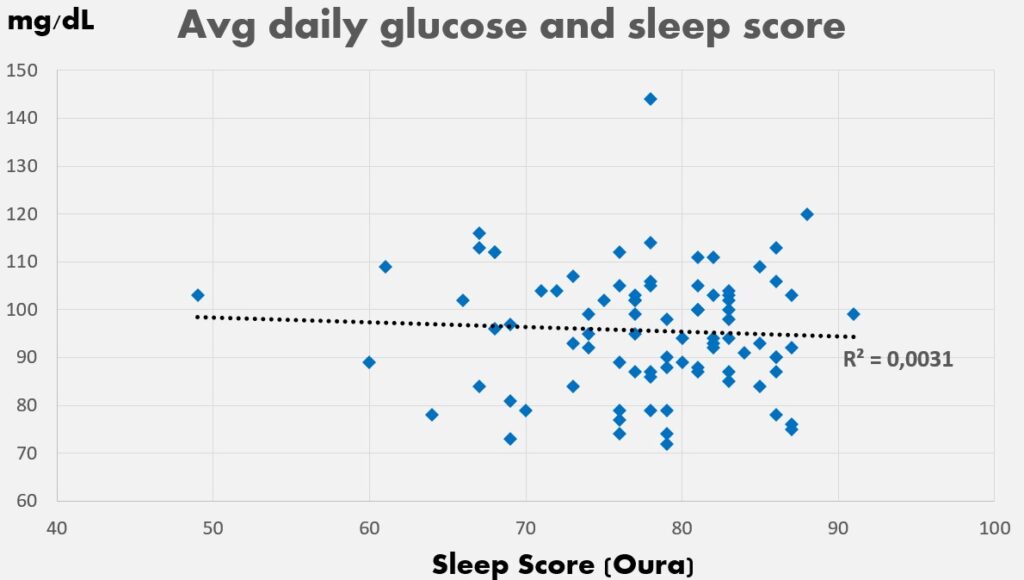
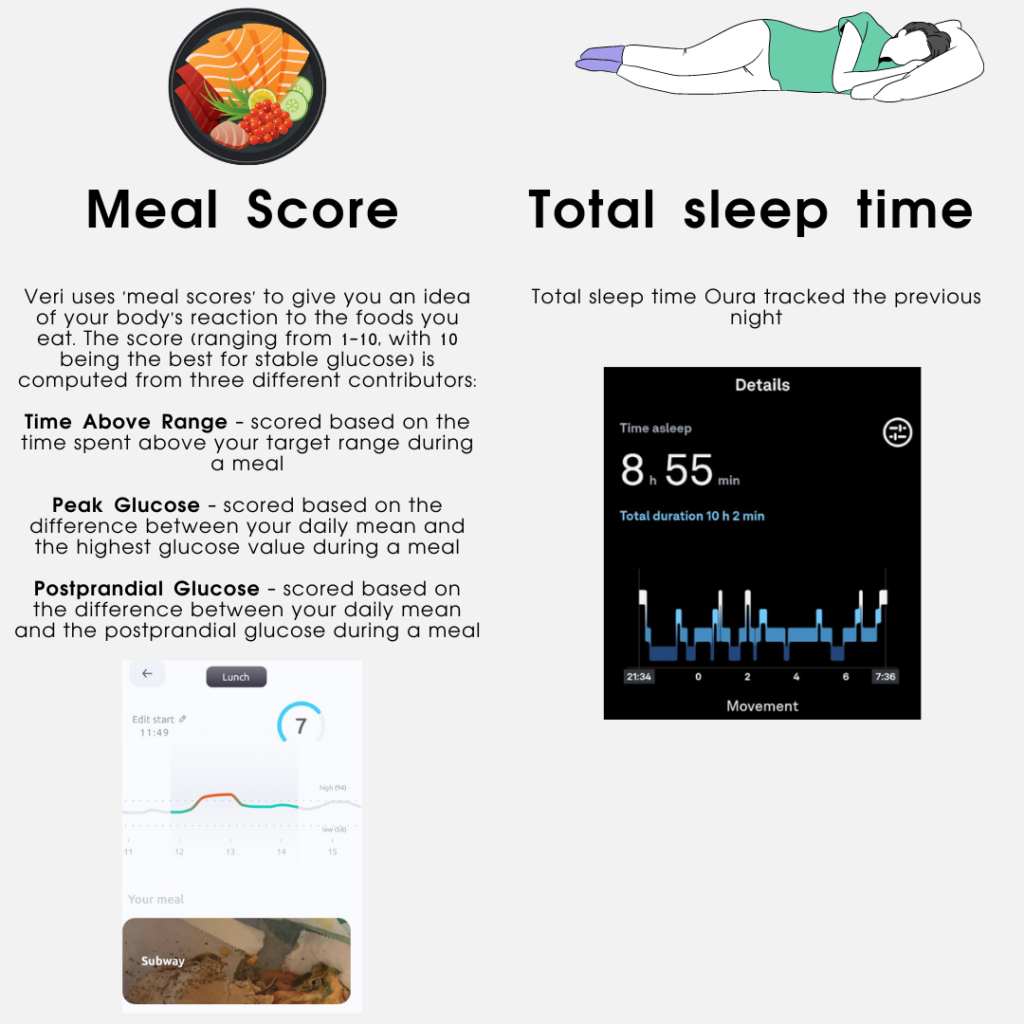
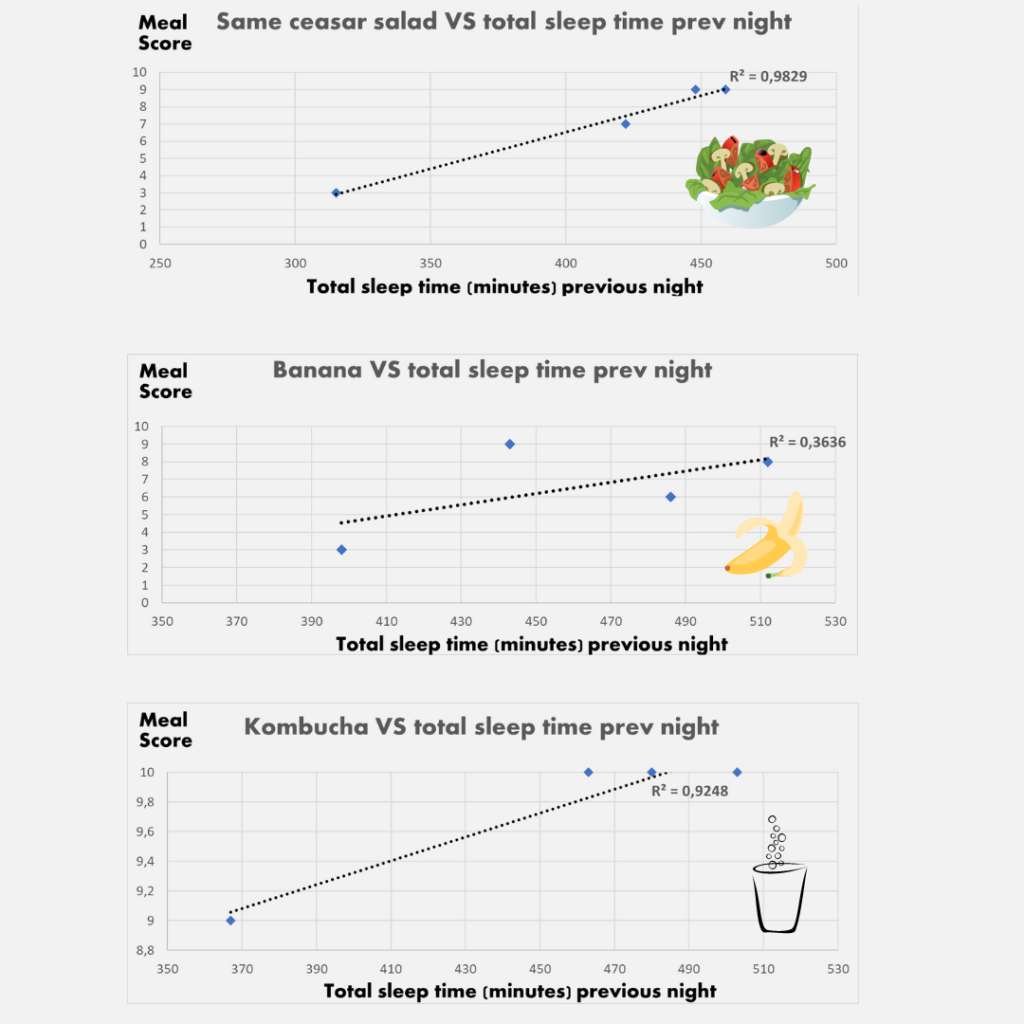
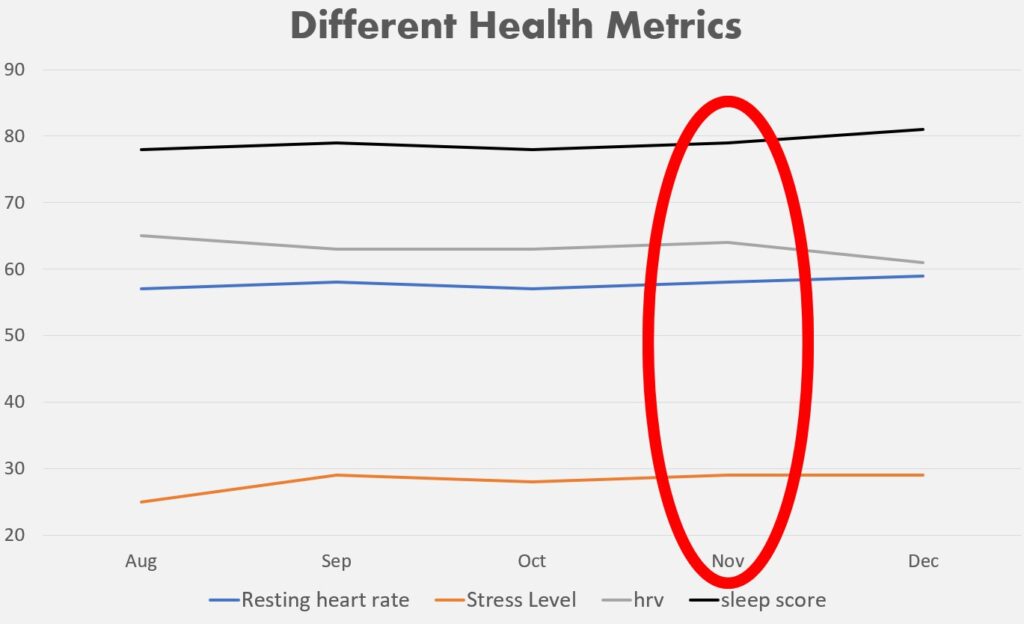
3. Surprisingly, finding correlations between sleep statistics and glucose levels wasn’t straightforward. Reason for this most likely is the number of factors influencing glucose levels. However, glucose levels in meal comparison showed a correlation between sleep time in a small sample size.
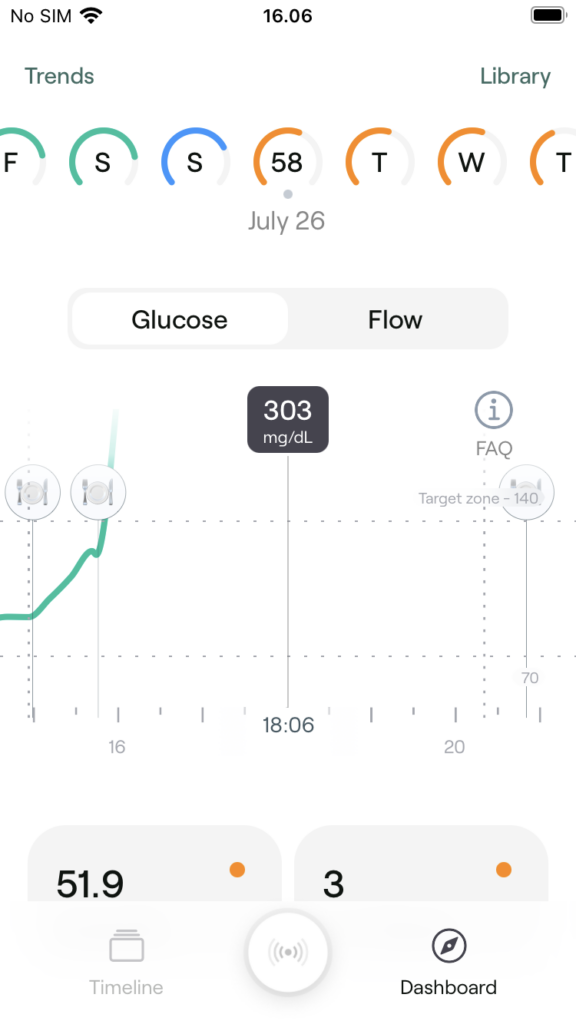
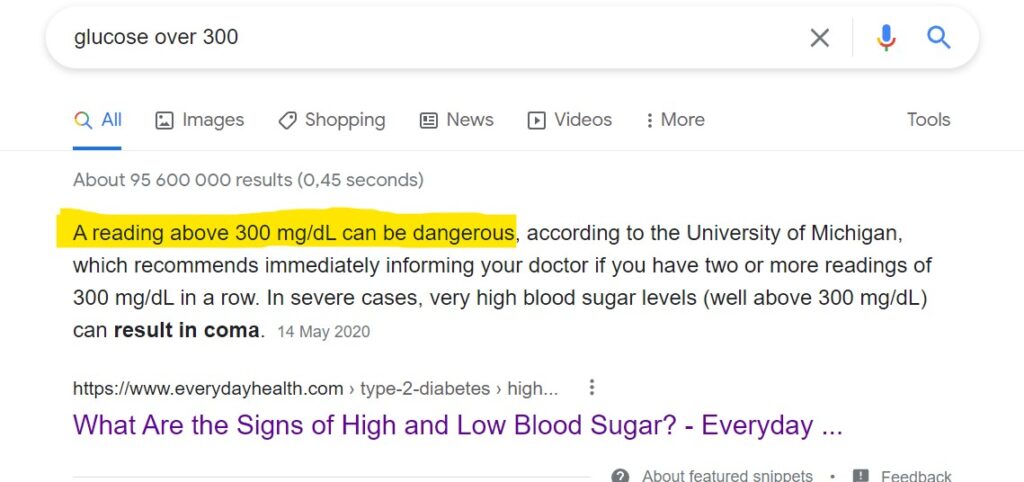
4. Public speaking can spike CGM reading over 300 mg/dL. I want to understand this better; Is it an accurate number, and how can it be so high?
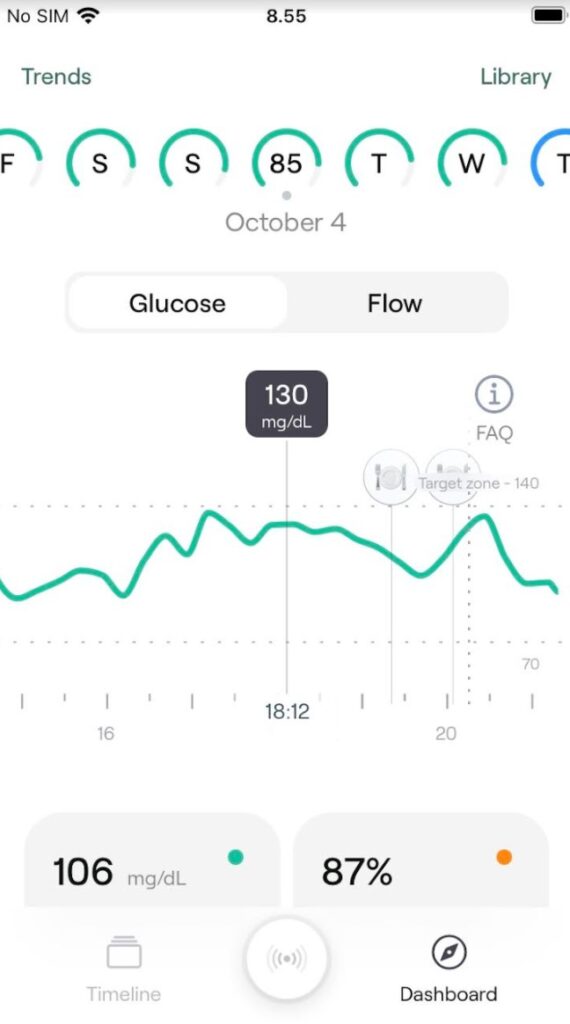
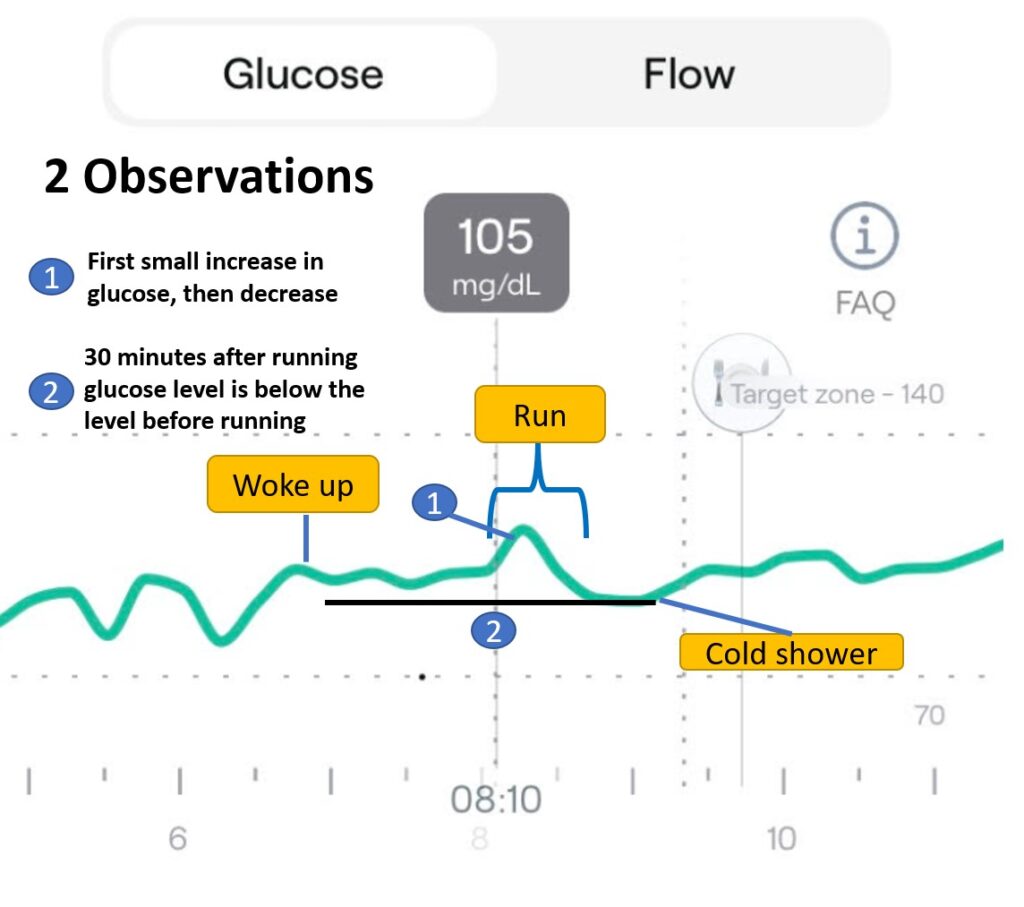
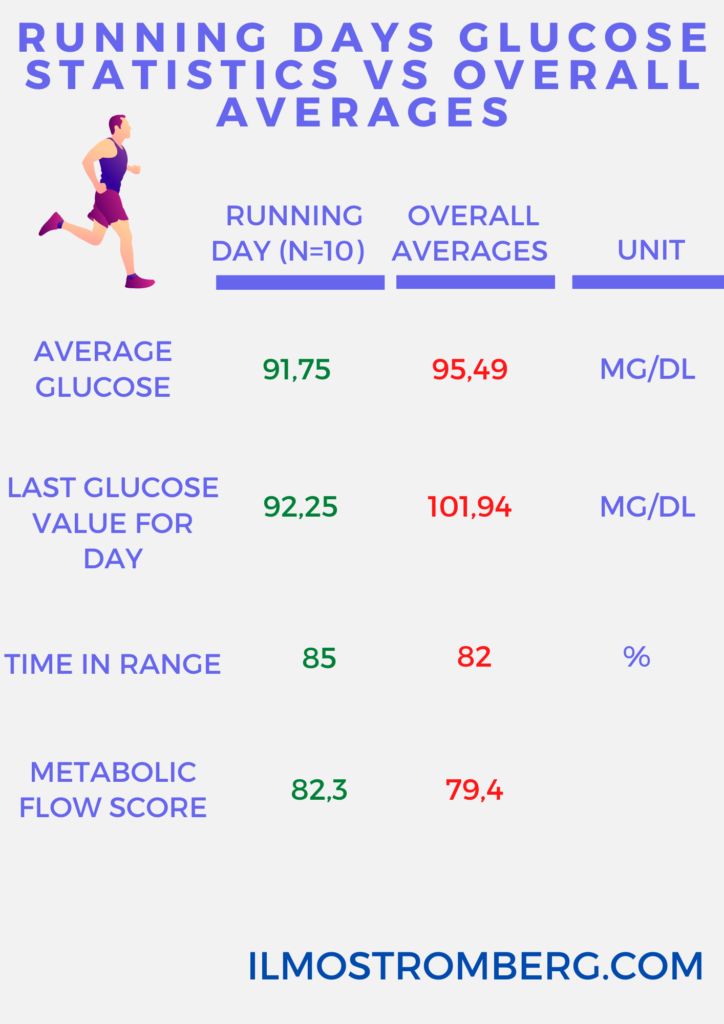
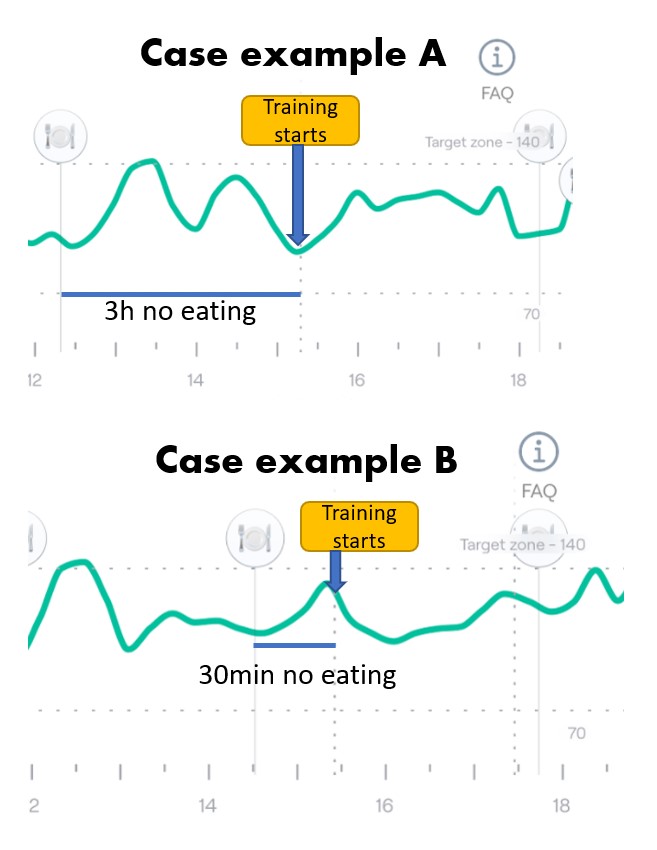
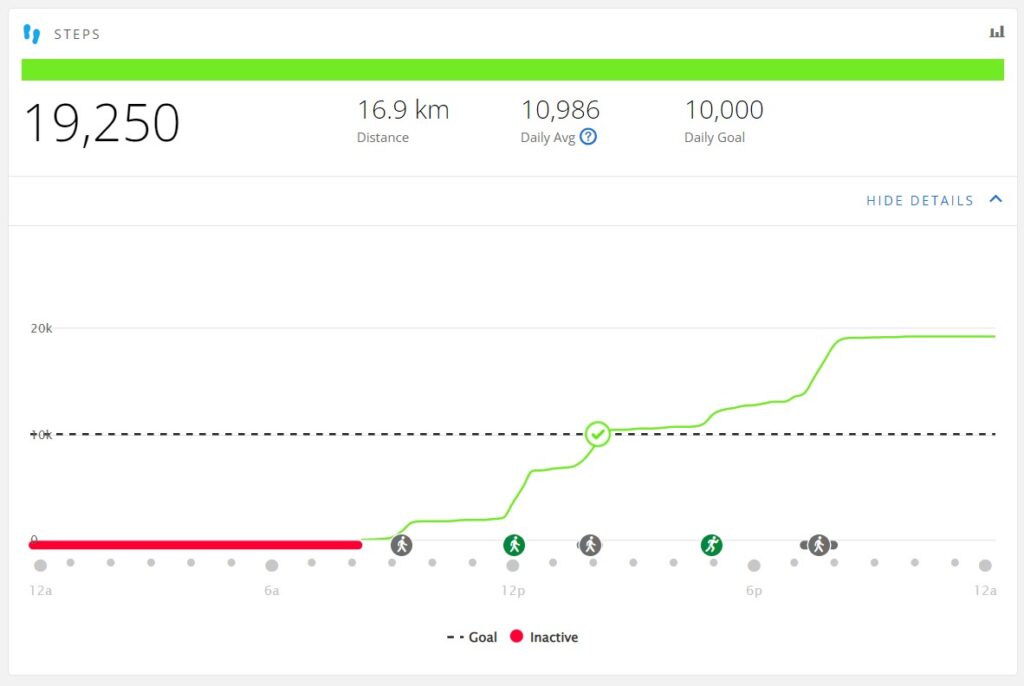
5. Running is an excellent way to decrease glucose levels.
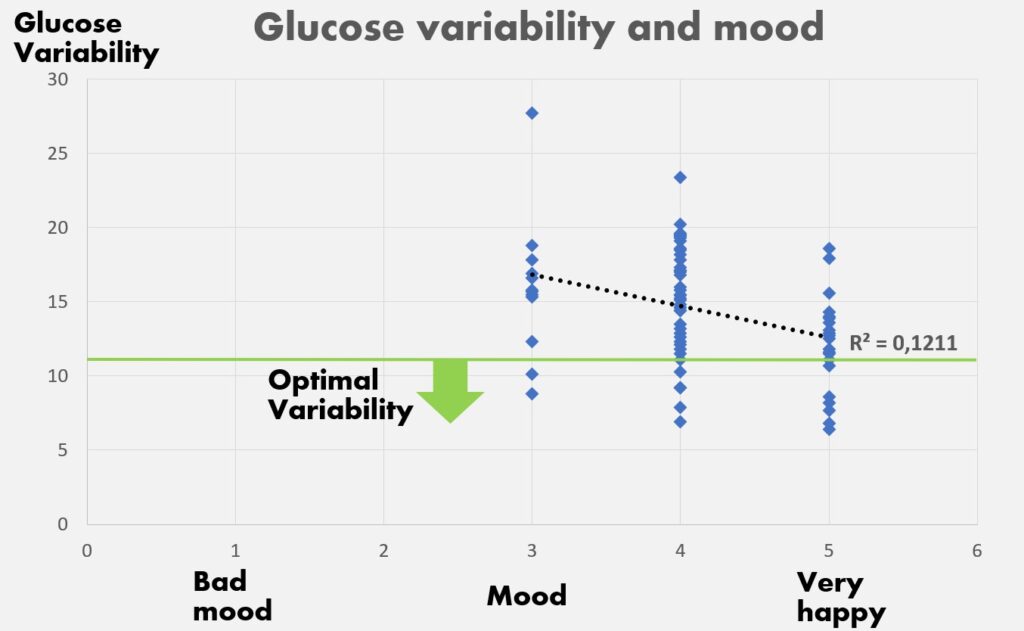
6. Steady glucose variability correlates with a happy mind. The big question is, is it an unhappy mind that causes glucose variability or high glucose variability that causes an unhappy mind.
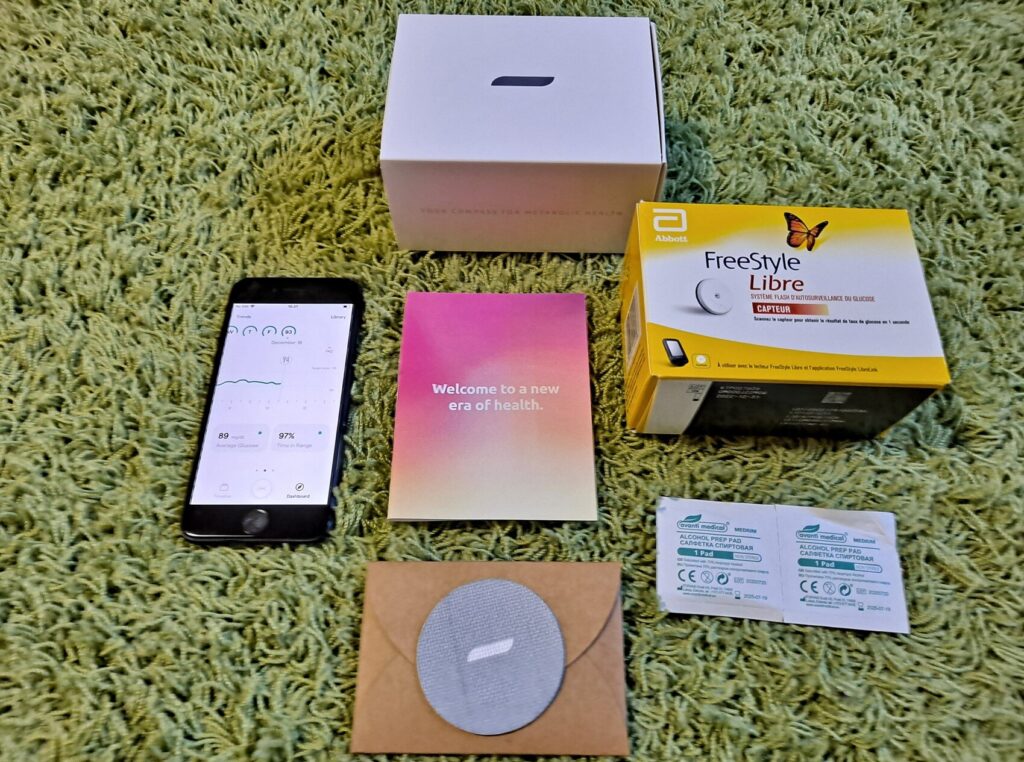
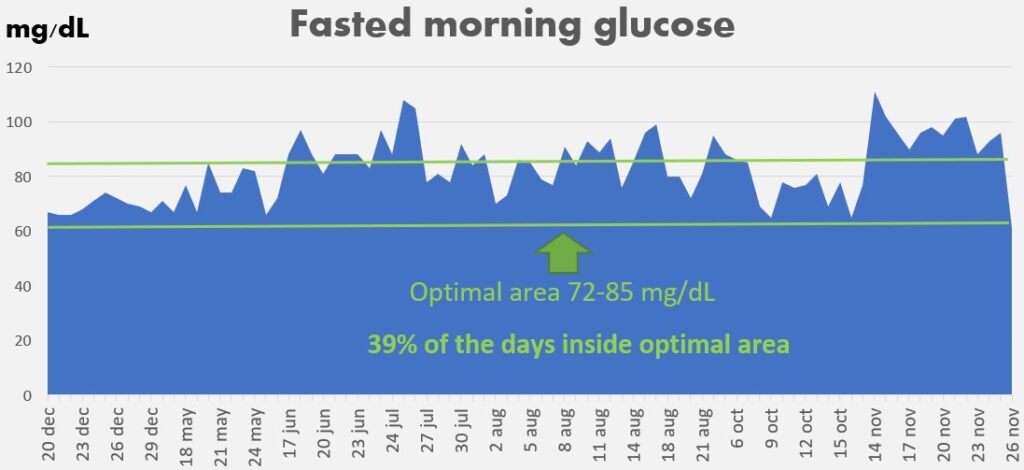
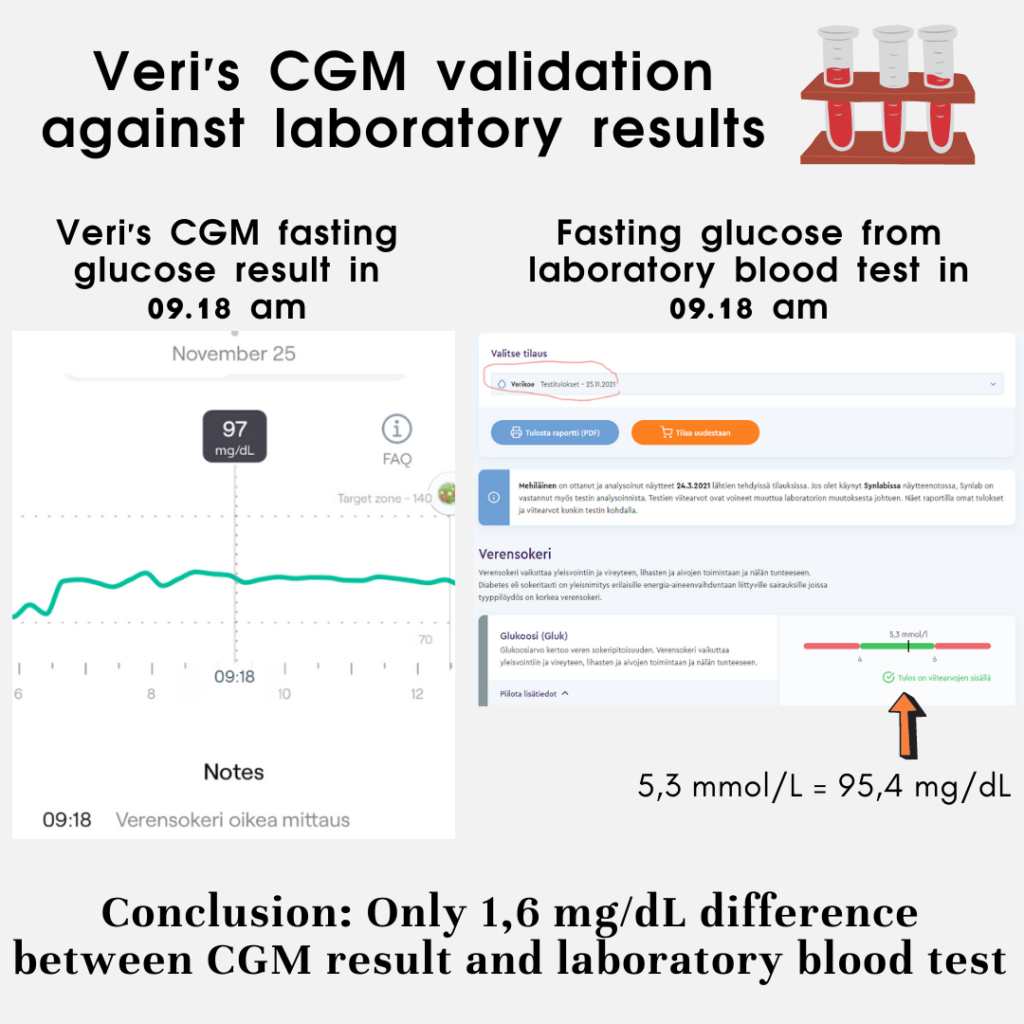
7. The sensor Veri uses (freestyle libre) is accurate, with only a 1,6 mg/dL difference compared to the actual fasting glucose test.
8. In November, my glucose values were out of optimal range, good wake up call to focus more on metabolic health.
Focus in 2022
1. Improve glucose statistics back to an optimal level
2. Do an official glucose tolerance test
3. Experiment with different ways to reduce glucose spike after the meal
I will write an update in 2022 about my glucose experiments.
Thank you for reading!
Ps. You can use my referral link to get 30 dollars off from your first Veri sensor order or use code VSM-ILMOST


This Post Has 14 Comments
Hi Ilmo,
Just wanted to let you know that I really appreciate your posts. There is so much undocumented talk within the biohacking and dieting communities, and you stand apart with your thorough analytical approach. Keep up the good work!
Hi Rasmus
Thank you for your comments. Feedback like this is really motivating
br, Ilmo
Great article thank you!
“Surprisingly, there was no correlation between average daily glucose level and sleep score”
I suppose this is due to that Oura is not polysomnography which is used in studies, and Oura, like any other sleep wearable, is not so good at detecting sleep stages as polysomnography and can mistake much in sleep stage detection which you take to compare with glucose levels. Oura is not good for sleep stage detection even compared to simple EEG – https://www.youtube.com/watch?v=MlIbhv2cWoE
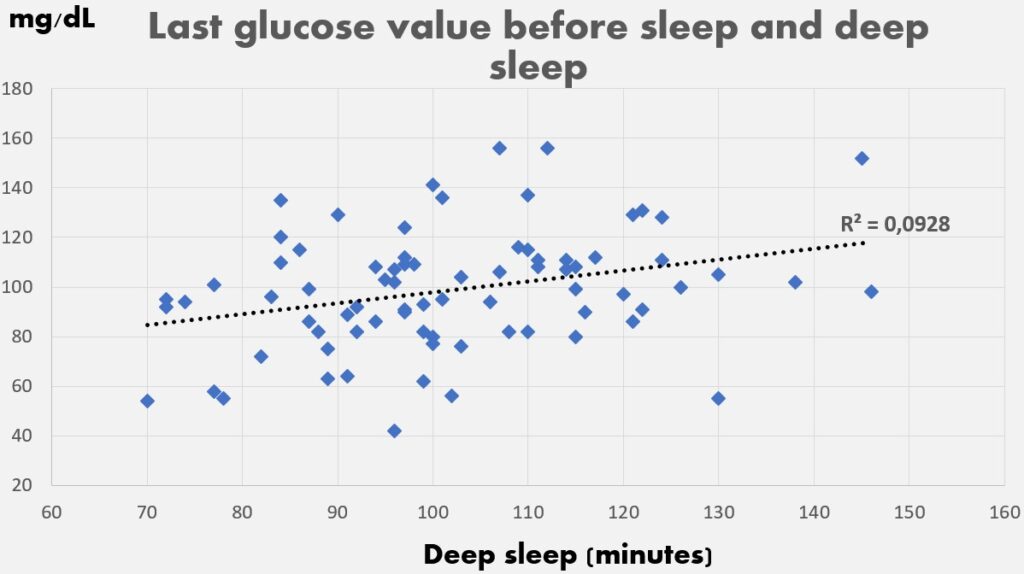
Same with “Last glucose value before sleep and deep sleep”. You compare glucose to messy sleep stage data.
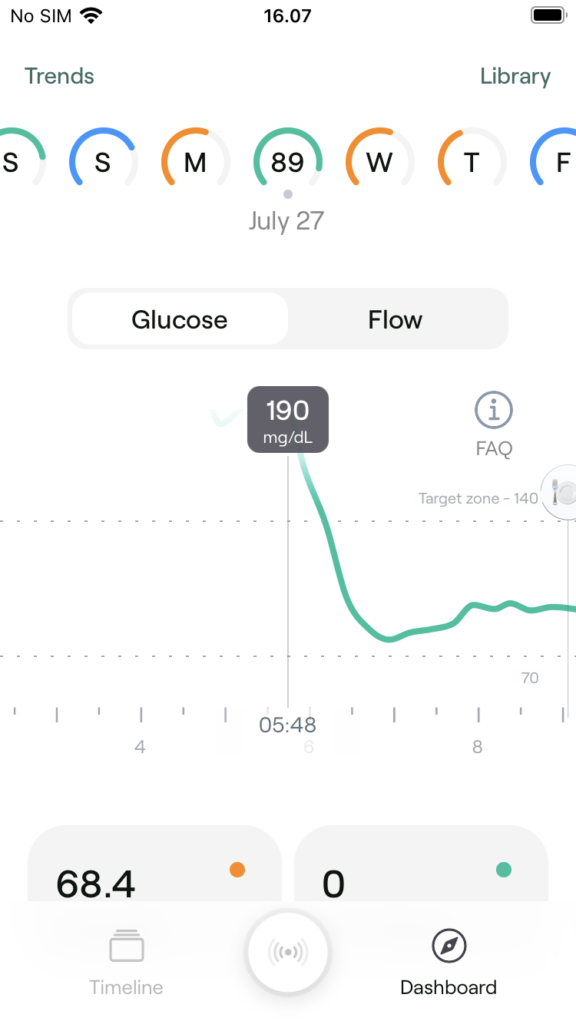
I see that you have a lot of data points of glucose level before sleep at the level lower than lower healthy level – 75 mg/DL. Maybe you have a bad deep stage due to hypoglycemia which rise cortisol and harms the deep stages?
“Sure, being on the stage was stressful, but otherwise, I felt normal. It had to be a sensor malfunction, and after 14 hours, it started to work again. ”
It is a pity that you didn’t compare to glucose level data from Veri with simple strips glucometer.
Maybe you get a higher glucose level in November due to a change in environment – lower ambient temperature, less sunlight (less vitamin D)?
Always good feedback from you Oleg, really appreciated.
You are correct about Oura, I trust total sleep time somewhat but other than that can’t put too much emphasis. Now writing this, I realized that I should have actually just looked at total sleep time in correlation analysis, not sleep score.
Very interesting point about low glucose value before sleep – I need to analyze that, and maybe even update the post. Thanks!
You might be right regarding November – Fast googling found the following sentence from one study: “It has been shown that the population average blood glucose level of diabetes patients shows seasonal variation, with higher levels in the winter than summer.” Will research this also more
br, Ilmo
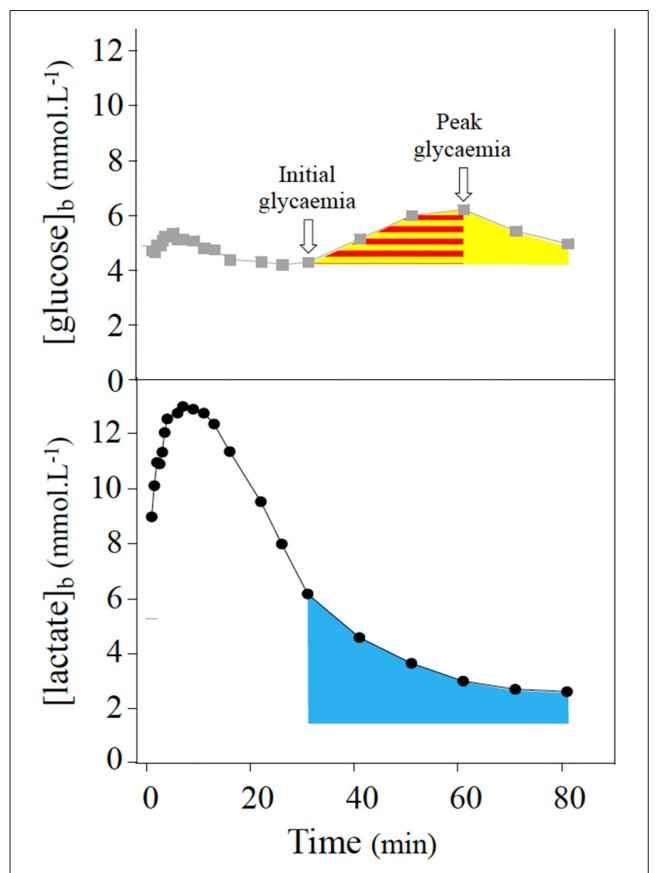
kiva kuulla että olet testaillut verensokeria. Minua kiinnostaa verensokerin dramaattinen lasku pitkäkestoisessa airoobisessa harjoituksessa 2-4 h jolloin kehon omat lihaksissa ja maksassa olevat glukoosit on käytetty, miten sitten tankataan ja mitä tankataan. testiti odottavat kevään ja kesän pitkiä pyöräretkiä, jolloin voi rasittaa kehoa pitkaan totaalisesti uupumatta. kari korpiola
Nyt löytyy kokemusta vain 1h juoksulenkeistä verensokerimittarin kanssa mutta voisin itsekkin kokeilla keväällä/kesällä 20km-30km että miltä data näyttää. Hyvä idea!
The correlation between previous night’s sleep and next day’s BG impact from meals is really interesting.
I have T1 diabetes and have also found no correlation between sleep and average blood glucose, but I haven’t checked for impact on individual meals. I’ll have to test it out myself.
Thank you for your comprehensive analysis. You have grabbed a very interesting topic.
May I throw in a research idea in between?
I have only had Oura for a few months, but I have noticed that a tablespoon of honey shortly before going to bed gives me better sleep results. However, my patience is not enough to follow this leed as closely as your follow-ups are. I haven’t been looking for any research results to confirm my honey theory either, but if you’re looking for more test ideas, I’d really appreciate it if you took up this topic.
Thank you for your comments
I have heard about honey before bed but haven’t really tried it. But I could see it work and I like honey so I’ll give it a try.
There’s actually one interesting double-blind study ongoing regarding honey to improve sleep quality https://clinicaltrials.gov/ct2/show/NCT04207281
Very interesting again Ilmo!
I’m also curious to hear about:
– Was there a surprising fooditem that spiked your glucose? (Like with Rhonda Patrick’s white rice example – if I’m not mistaken)
– Do you know if there’s a long term benefit for a lower glucose score overall?
– Do you know about studies who look at the negative effect of glucose spikes (after eating)? Is this something which is more important compared to a lower glucose score overall
– Have you also done a longer fast? (3 days?) When I did that, my values dropped below ‘good’ levels 😅
– Will you try Berberine for your next CGM experiment? It should work on lowering your glucose level (Huberman Lab: Effects of Fasting & Time Restricted Eating on Fat Loss & Health | Episode 41)
Cheers,
Tim
Thanks Tim
Fresh orange juice spiked like crazy, it’s not surprised as there are like 10 squeezed oranges to get 0,5litres of juice. I’m not drinking that anymore lol (even though its organic).
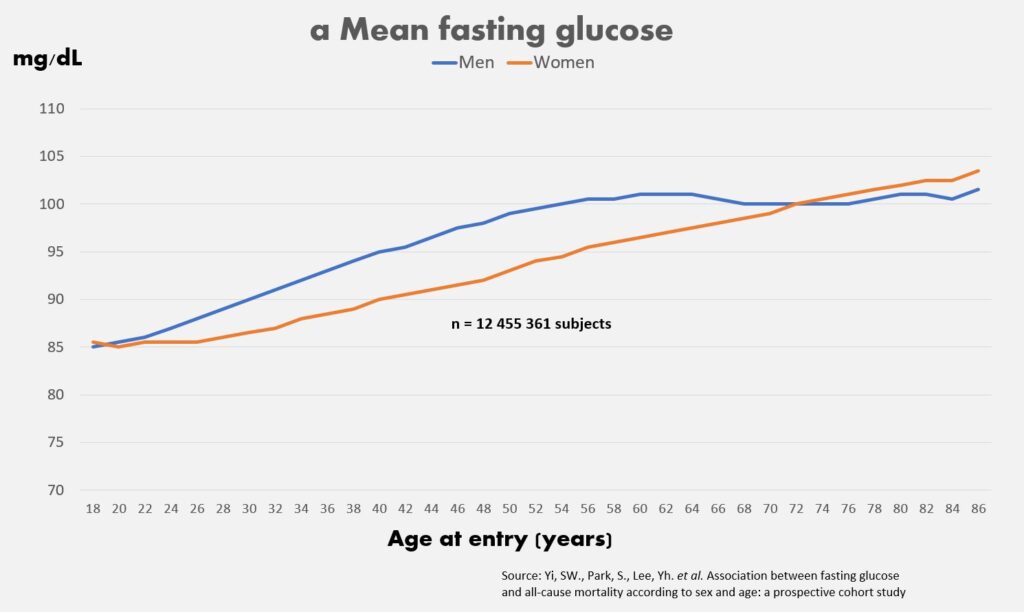
According to studies, there’s an optimal range where mortality risk is lowest (obviously too low is not good either).
Major spikes after eating causes overproduction of superoxide, which can lead to endothelial damage. So you want to reduce the (significant) spikes so oxidative stress can be diminished. I think the newest science is now actually leaning more towards the importance of glucose spike management, than the overall glucose average.
I have only done 24h, I’m such an exercise junkie that I would have hard time fasting 3 days without exercising 😀
Yes, Berberine is definitely on my radar. I have a feeling that post-lunch walking is better than berberine, apple cider vinegar etc. but will need to test it multiple times.
br, Ilmo
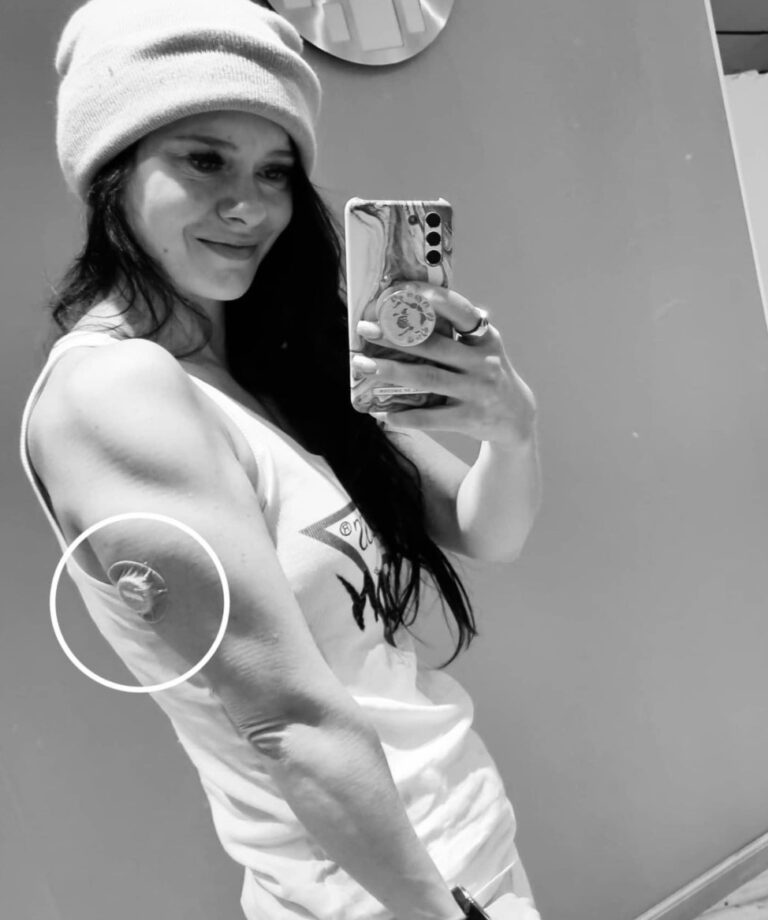
So you are a man or woman?
Man
The woman in the picture is my girlfriend
Where there is a will, there is a way.