Sudden long-term decrease in HRV is a popular topic in various health forums; it’s interesting to read about it, but you don’t want to see that trend in your own HRV graph.
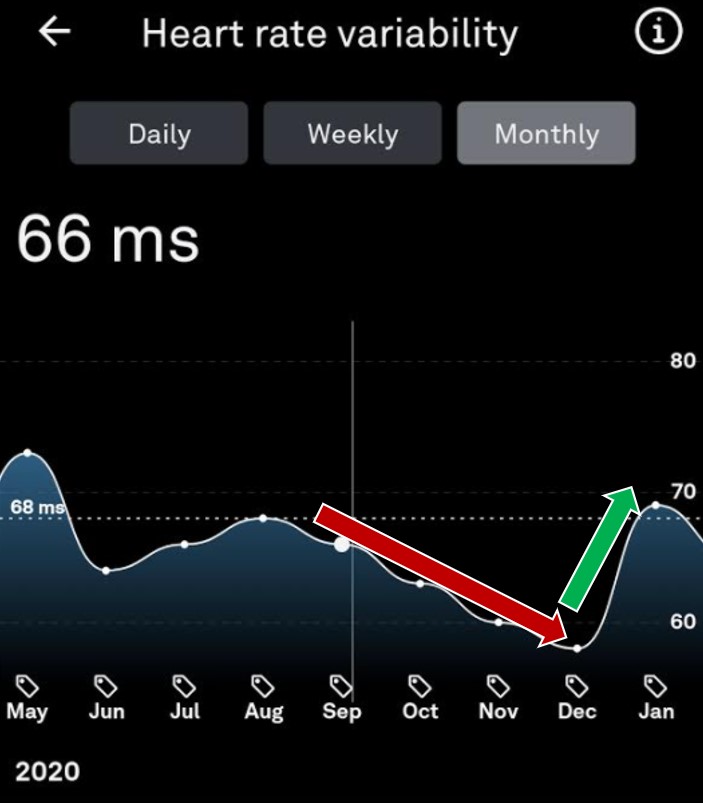
My monthly HRV went down like it was a waterslide. I have to admit that I was a little bit worried in December, especially when I had a hard time pinpointing the reason for that.
Monthly HRV values from Oura app
I’m not going to explain here what is HRV and why it matters; if you are new to the topic, check out my previous blog post here.
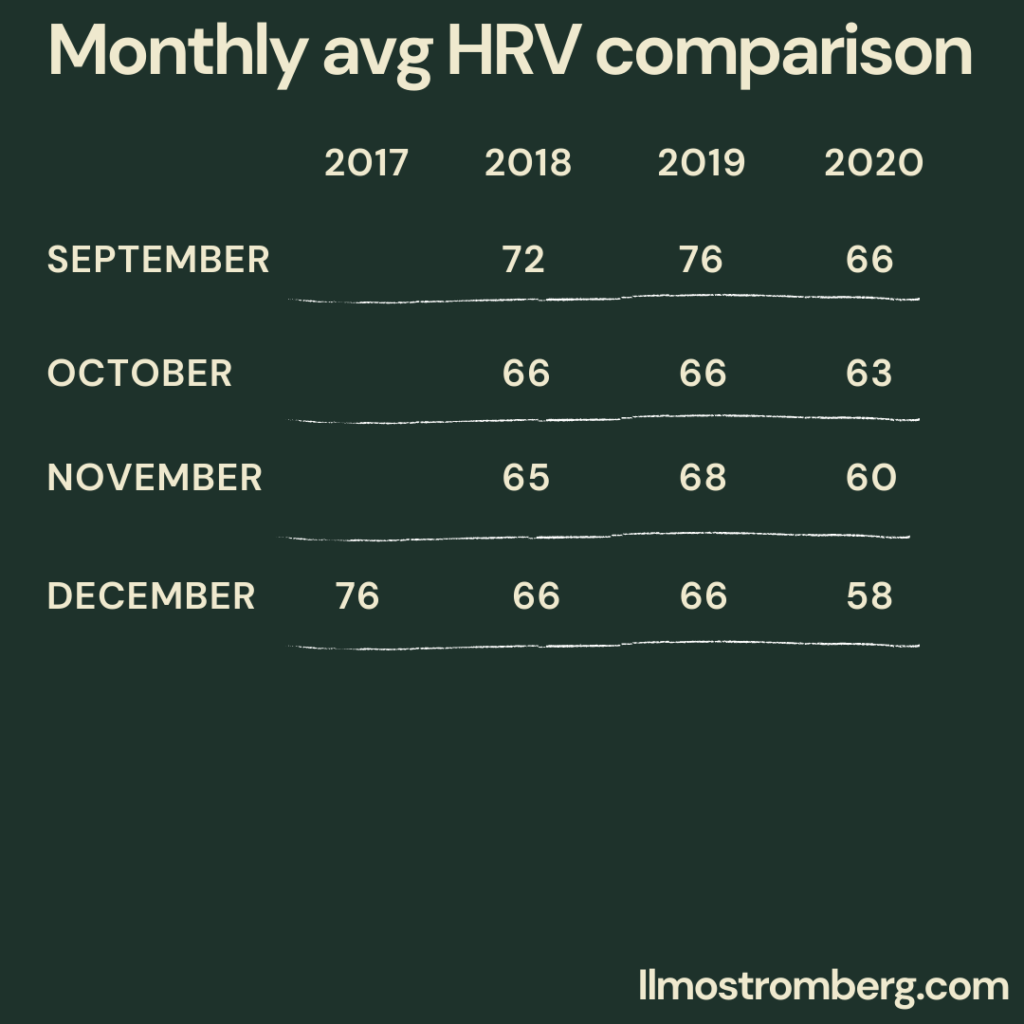
I have been using Oura since 2017, so I can compare 2020 data to previous years.
Monthly HRV values from the past 4 years (Oura)
In September average HRV was 66; it was far behind from 2018 and 2019 values but still near to overall average (68). In October, I noticed a downward trend the first time. Even though 63 is near to 66, it was the lowest monthly HRV value ever.
In November, I realized that something is really going on as I was starting to get values under 60 without any specific reason (no late-night meal or hard training in the evening).
I was worried the first two weeks of December; my weekly HRV was around 53, which’s is over a 20% drop from average values.
I have 3 goals in this blog post:
Investigate what caused the downward trend in monthly HRV
Understand how did I bounce back in January 2021
Give readers tools and ideas if you are experiencing a similar HRV slump.
Seasonal changes in HRV
Could it be that cold winter decreased my HRV in 2020? It is well known that HRV is higher in the summertime and lower in wintertime [1].
This theory doesn’t seem plausible when looking at the numbers from 2017, 2018, and 2019. Still, I wanted to check the average temperature in December Helsinki city for these years. 2018 was significantly colder than 2020, so this theory doesn’t hold up.
This wasn’t relevant in my case, but it’s an important point to consider, especially when you measure your HRV values first time in winter.
Mental aspects
Could I be suffering from seasonal depression (because of cold dark winter), or did I have extra stress from work? Let’s analyze this!
If you have been reading my previous posts, you know that I’m logging lots of data into Daylio, including my mood (I’ll probably someday write a review about Daylio).
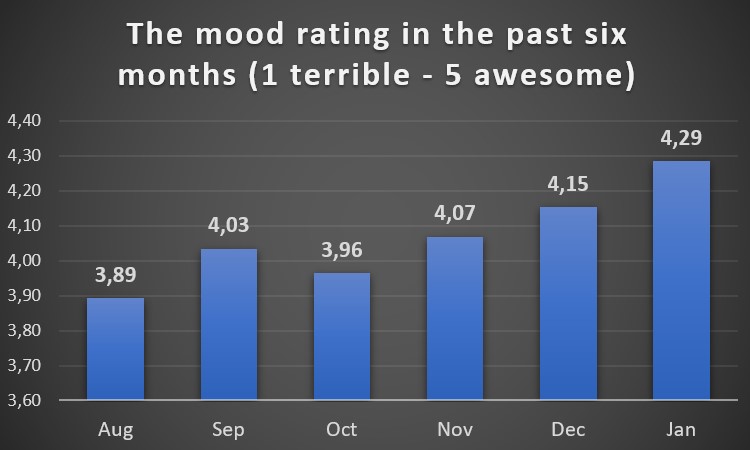
My mood shows the following trend:
Mood data collected from Daylio app
Whatever caused my HRV slump didn’t seem to have a negative impact on my mood.
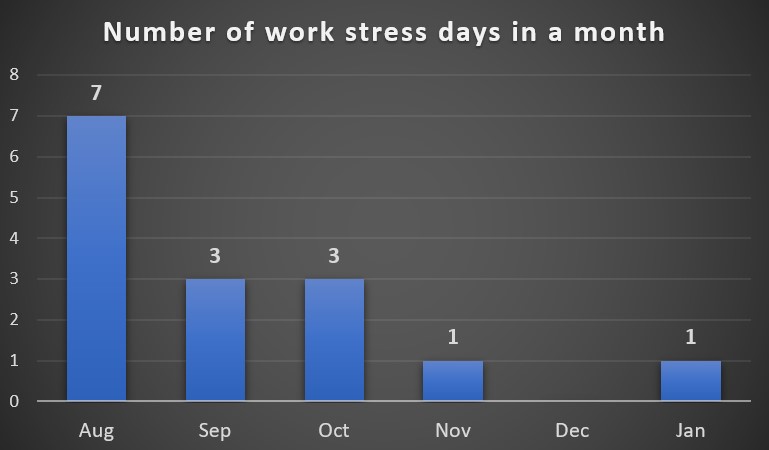
What about work stress? I have included that into the Daylio portfolio; whenever I feel stress from work, I chose that icon end of the day. Data looks like this:
Work stress data collected from Daylio app
It seems like August was a stressful month at work; almost 1/3 of workdays that month, I felt significant stress. That correlates with mood; I only got 3,89 in august. That said, I didn’t find the answer here either. Work stress should impact HRV immediately, not in few months lag.
With mental aspects, I got dead-end – Now, what about physical aspects?
Physical aspects
What was my level of physical activity from August to January? I log my training also into Daylio. I train mostly calisthenics (and weighted calisthenics), but every now and then, jog and box.
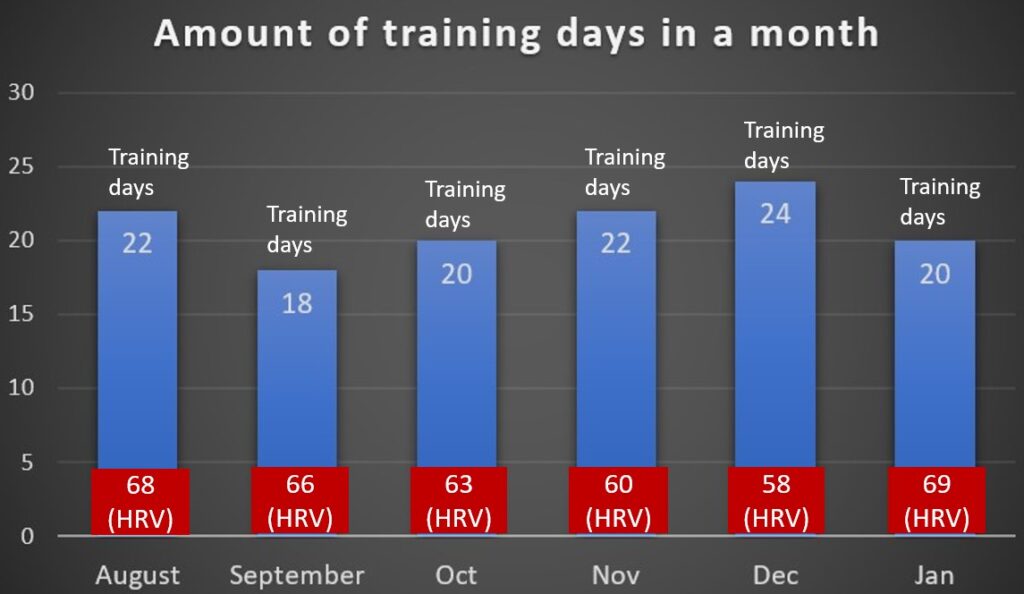
Training days in a month combined with monthly HRV values (Oura & Daylio)
This gets interesting; we can see that training days increase from September to December, and simultaneously HRV decreases.
This doesn’t consider the intensity level of training, but I know that I went hard in November and December as my elbow healed and I could perform all the things I wanted.
August and November had the same amount of training days, but the HRV difference was 8 points. I think this can be explained with seasonal difference and training intensity.
Still, the difference between December and January in terms of HRV is significant. It cannot be explained with a seasonal difference (both are winter months) or training intensity (intensity was in the same range). There were 4 more training days in December, but it shouldn’t have such a drastic impact.
We can simulate this with the following simplified example. Have 30 values of HRV (all 65) and then change 4 values to 55 (decrease of 10 for each day). This changes average from 65 to 63,7. Now decrease of 10 from average after training day is already pretty rare for me.
Increased training days and intensity probably caused HRV decrease, but there are still open questions:
Do other data points support this hypothesis?
Why did my HRV bounce back such drastically in January?
Increased training should be visible in heart rate also:
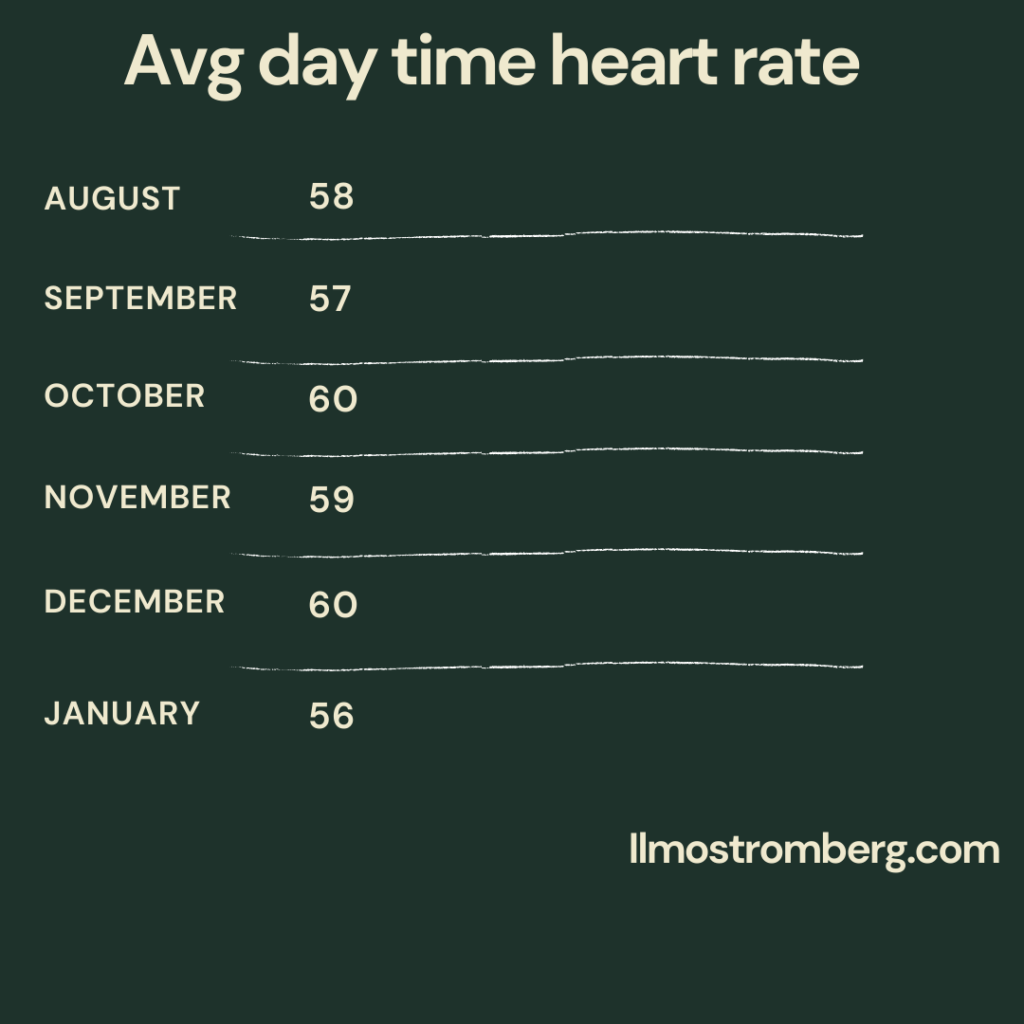
Average day time resting heart rate (Garmin vivoactive 3)
Average day time heart rate didn’t show a similar trend as in HRV. Still, the highest value was reached in December (but also in October). That said, it was interesting how much heart rate dropped in January.
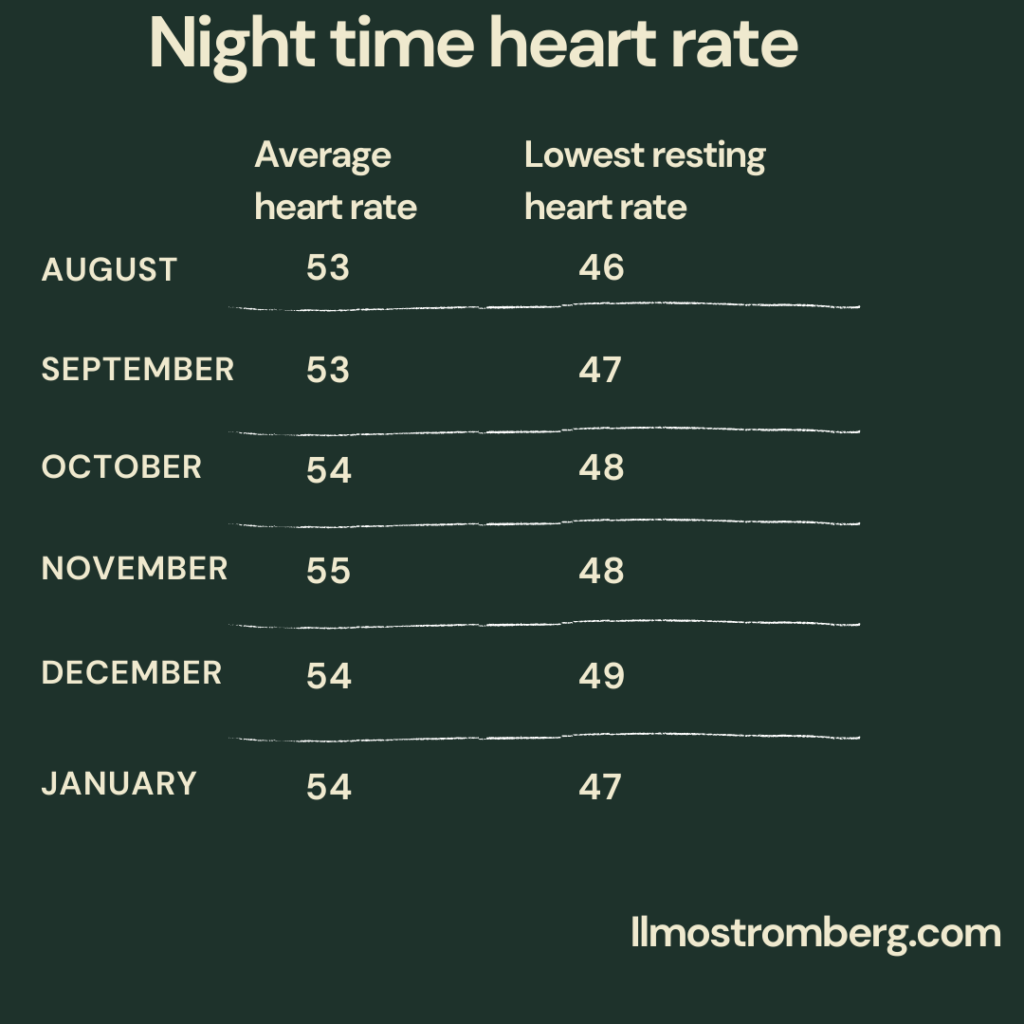
Night time heart rate (Oura ring)
It was surprising to find out that the average night-time heart rate didn’t tell us anything. In the Lowest resting heart rate trend was similar to HRV but the difference was smaller.
One older study concluded that an increase of 5 beats per minute in resting heart rate or more is a strong sign of overtraining [2]. Biggest variation in my heart rate data seemed to be in average day time resting heart rate. I wanted to look 2019 to understand this better:
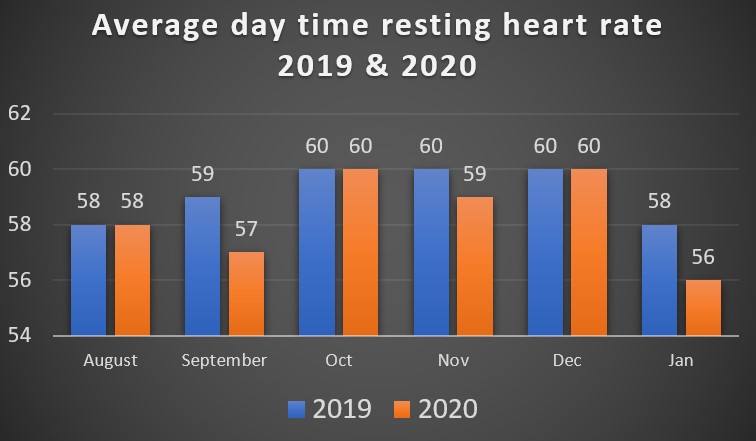
Average day time resting heart rate (Garmin vivoactive 3)
My resting heart rate was on the same level as 2019 or lower. Based on this, it doesn’t look like the possible overreaching was affecting my heart rate significantly.
Sleep
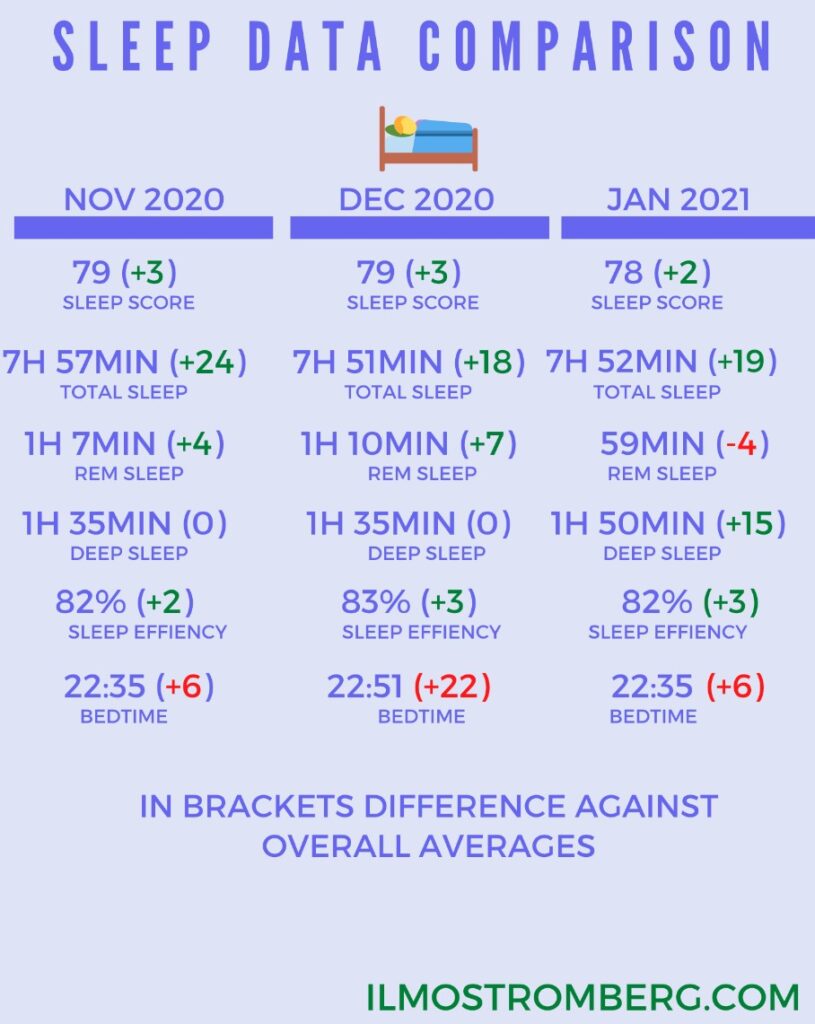
If I was reaching towards overtraining, there should be a sign of sleep disturbance. I compared November, December, and January against overall averages.
Sleep data comparison for past 3 months (Oura ring)
Even though bedtime seemed to be later in the past 3 months, other scores were a little bit above overall averages.
One thing caught my eye, however – Deep sleep increased 15 minutes in January. What kind of correlation does deep sleep have with HRV? Now it gets super weird..
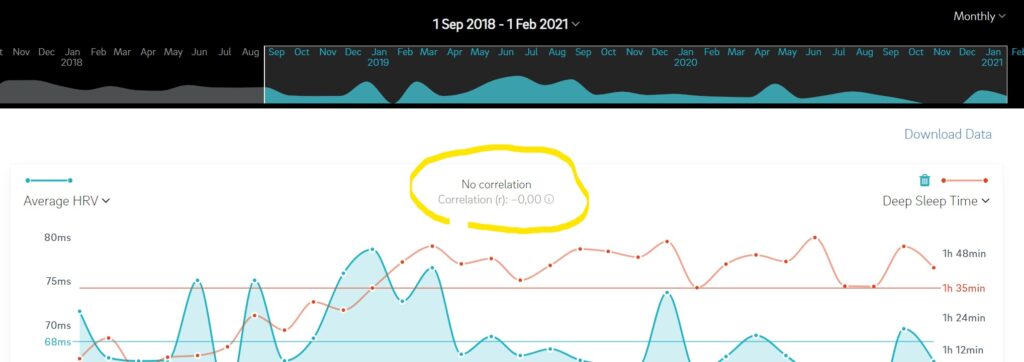
Average HRV and Deep sleep correlation with Gen 2 Oura ring (Oura cloud)
Seems like there was no correlation in 2 year of data (-0,00). However, when I change the timeline to 2020 things changed drastically:
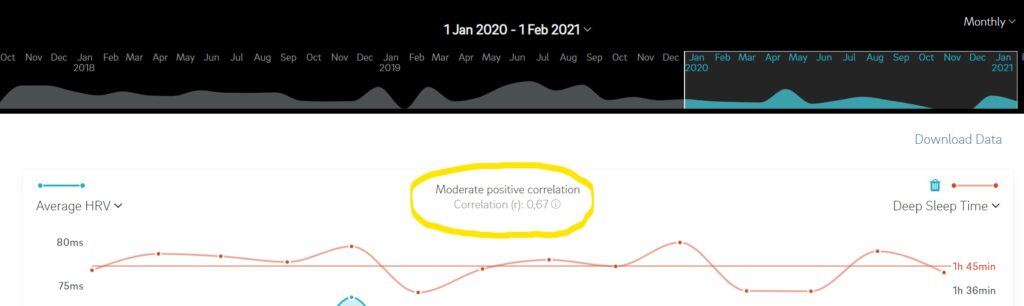
Average HRV and deep sleep correlation for 2020 and 2021 (Oura Cloud)
Now there is a moderate positive correlation (0,67). It makes sense that HRV increases during deep sleep as heart rate drops about 20% – 30% of wake resting heart rate [3]. But why is there such a drastic difference in 2020-2021 data and 2018 to 2021 data? This finding probably deserves its own blog post. If you have any theory or knowledge about this, please reach out!
This finding can give answers to increased HRV in January. What about deep sleep and over-training? I searched the internet but didn’t find any exact studies on this topic; however, one study concluded: “large proportions of deep sleep potentially reflect an elevated recovery need” [4].
Now we have gone through sleep, mental- and physical aspects. In the last part of the investigation, I want to go through HRV at a weekly level with training amounts.
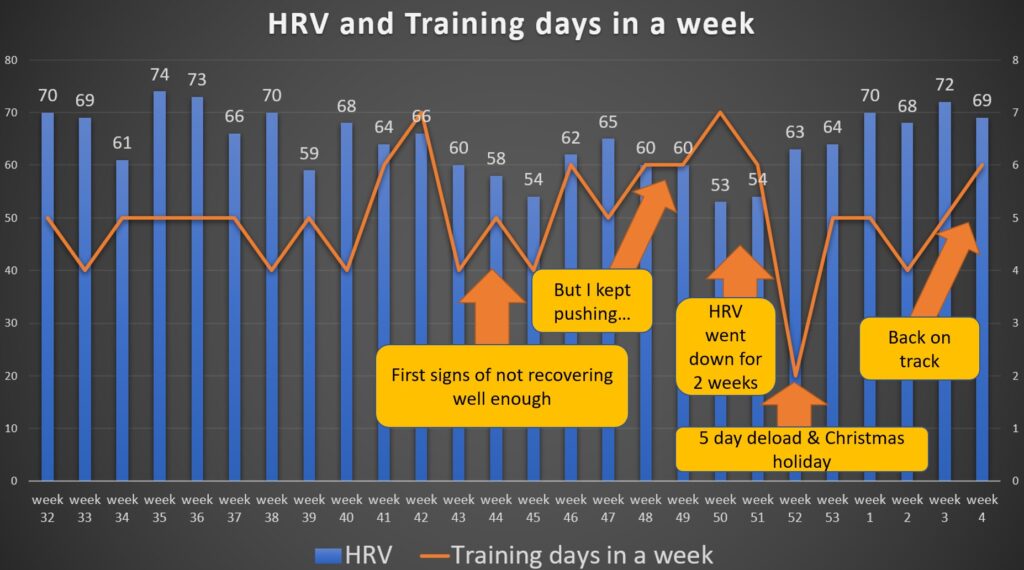
HRV data in weekly level with training amounts
When I combined data at the weekly level, it became clear that training affected my HRV.
Training days and HRV in weekly level (Oura & Excel)
During November and December there was a 33 day period with 29 training days. First signs of not recovering well happened in week 44 and 45. Training hours increased after that which most likely caused 2 week HRV slump in week 50 and 51. Christhmas holiday and 5 day deload was truly needed.
What did I learn here?
To this day, this was the most enjoyable blog post to write. I didn’t know what direction it will take; I just started to analyze data from different sources.
Based on data, it’s safe to say that intense and frequent training decreased my HRV. We can use Occam’s razor here: The simplest explanation is usually the right one. Note to myself: It wasn’t Covid or any other disease, and I didn’t develop cat allergy out of nowhere.
The big question is, how far away was I from serious overreaching/overtraining?
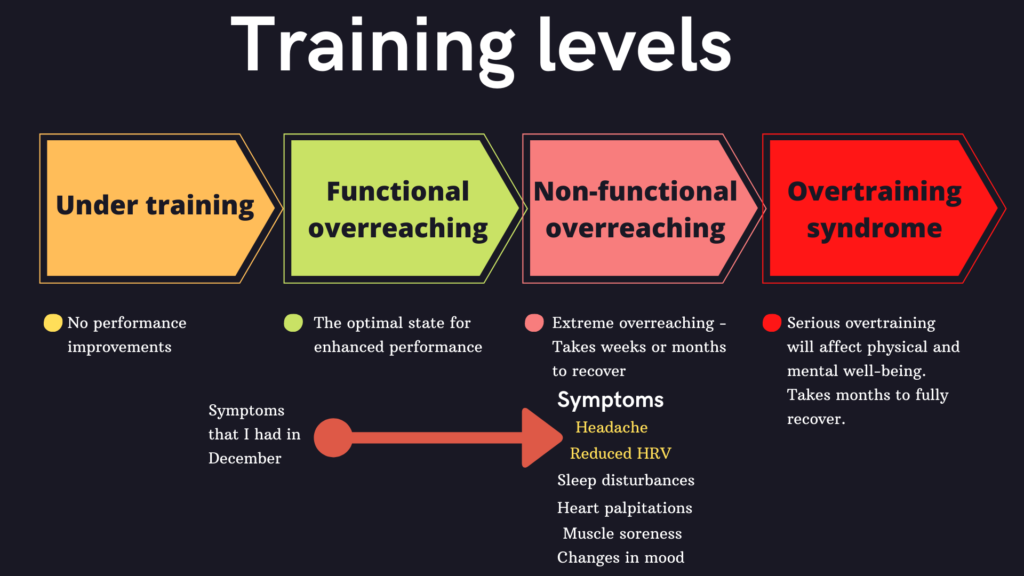
Training levels and symptoms in unwanted levels
As I was only experiencing reduced HRV and headaches, I would say I was on the road towards non-functional overreaching.
I didn’t notice the difference in mood or sleep, but things would probably have gone negative if I hadn’t taken the de-load week. This speaks to the importance of HRV monitoring.
If I could do the December again, I would take easier weeks 45 and 46 when the first real signs of unsuccessful recovery appeared.
From now on, I will keep monitoring my HRV, especially at the weekly level, along with the training data. Before this, I looked at my daily HRV in the morning but didn’t analyze the bigger picture.
It’s also important to point out that I stopped looking at daily HRV values in December for few weeks because it wasn’t a good start for the day to see decreased HRV values. We should be very conscious when we measure ourselves; it should be a way to optimize ourselves, not to do more harm.
awesome post! Last month I did a similar trend and correlation study on my data to learn why my HRV spiked starting in Jan. in my case, I’m hypothesizing that Garmin is a better tool for estimating time to recover. I stopped using Oura in Oct and switched to using my Garmin 645 to determine when my body was ready to train. For me, the Garmin has a more accurate assessment of recovery time, resulting in a higher training load (Oura was too conservative in estimating my readiness, resulting in too many recovery days). Over a 2 month period using the Garmin to guide when to engage in higher intensity sessions, my HRV steadily climbed and resting HR remained low, indicating adequate recovery. I continue to use Oura for HRV, but IMO Garmin645 is superior for estimating recovery and readiness to train.
Honestly, that’s not the low HRV scores you are talking about, just small dips. It’s nothing to worry about and i.m.o. over-worrying about some data points.
Chronicle HRV levels in the 20-30 zones is what should worry a human. 60+ scores are very very average and healthy for 99.9% of humans.
A human has ups&downs in life cycles, walking up to several months of stress/disease/discomfort to wear out. If you bounce severely from normal values to very low levels (20’ish) values, that’s dangerous and worth a deeper look into.
All the tools we get from the market are not always valuable. I this case I do not see anything you should have worried about. Just relax and take some more holidays, enjoy life and don’t over train.


This Post Has 6 Comments
awesome post! Last month I did a similar trend and correlation study on my data to learn why my HRV spiked starting in Jan. in my case, I’m hypothesizing that Garmin is a better tool for estimating time to recover. I stopped using Oura in Oct and switched to using my Garmin 645 to determine when my body was ready to train. For me, the Garmin has a more accurate assessment of recovery time, resulting in a higher training load (Oura was too conservative in estimating my readiness, resulting in too many recovery days). Over a 2 month period using the Garmin to guide when to engage in higher intensity sessions, my HRV steadily climbed and resting HR remained low, indicating adequate recovery. I continue to use Oura for HRV, but IMO Garmin645 is superior for estimating recovery and readiness to train.
Great post! thank you!!
Thank you GB
Interesting to hear, and I agree; Oura’s readiness score can be all over the place. I put also a most emphasis on HRV values.
Thanks for the great info Ilmo.
Regards.
Thanks Antonio!
Three things to look closer at:
1. Drop in REM sleep
2. Changes in time going to bed
3. Cardio training differences during this period
Also worth noting that though mood may be a side effect of cognitive fatigue and mental stress it can’t be correlated directly with HRV
Honestly, that’s not the low HRV scores you are talking about, just small dips. It’s nothing to worry about and i.m.o. over-worrying about some data points.
Chronicle HRV levels in the 20-30 zones is what should worry a human. 60+ scores are very very average and healthy for 99.9% of humans.
A human has ups&downs in life cycles, walking up to several months of stress/disease/discomfort to wear out. If you bounce severely from normal values to very low levels (20’ish) values, that’s dangerous and worth a deeper look into.
All the tools we get from the market are not always valuable. I this case I do not see anything you should have worried about. Just relax and take some more holidays, enjoy life and don’t over train.